VQ Probe v3.5 User Guide
Overview
VQ Probe is a visual instrument for objective and subjective video quality probation.
The tool is shipped as a Graphical User Interface application for Windows, macOS, and Linux.
Supported Video Codecs
- H.264/AVC
- H.265/HEVC
- H.266/VVC VTM-22.0
- AV1
- AV2
- AVS3 HPM-15.2
- MJPEG
- MPEG2
- VP9
Supported Uncompressed Formats
- YUV
- Y4M
- RGB
Supported Image Formats
- BMP
- JPG
- PNG
Supported Containers
- MP4
- TS
- MKV
- MOV
- AVI
- IVF
- WEBM
- PCAP
Supported Chroma Subsampling
- 4:0:0
- 4:2:0
- 4:2:2
- 4:4:4
- 4:4:0
Supported Bit Depth
- 8 bit
- 10 bit
- 12 bit
- 16 bit
Supported Video Metrics
- PSNR: calculated based on the regular formula (Peak signal-to-noise ratio); average noise of every pixel of the whole frame is calculated
- SSIM: we compute SSIM using the empirical downsampling process. For each image let F = max(1, round(N/256)), where N is the height of an image in pixels. The image is averaged within an F by F window and downsampled by a factor of F. Then the SSIM index is calculated by the following formula:
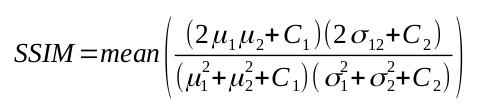
- where:
- C1 and C2 are constants equal to (k1L)2 and (k2L)2, respectively, where by default k1 = 0.01, k2 = 0.03, and L is the dynamic range of the images;
- μ1 and μ2 are the compared windows;
- σ1 is the difference between the first image squared and (μ1)2;
- σ2 is the difference between the second image squared and (μ2)2;
- σ12 is the difference between the multiplication of the images and μ1μ2.
- VMAF: this algorithm is used for VMAF calculation. Please follow VMAF: The Journey Continues for more information.
- CAMBI: Contrast Aware Multiscale Banding Index is Netflix’s detector for banding (aka contouring) artifacts. For an introduction to CAMBI, please refer to this article.
- CIEDE2000: we use this formula to compute color difference.
- MS-SSIM: this is a more advanced form of SSIM, called Multiscale SSIM. It is conducted over multiple scales through a process of multiple stages of sub-sampling. Read more here.
- PSNR-HVS: an extension of PSNR that incorporates properties of the human visual system such as contrast perception.
- VMAF-NEG: for comparing encoders, VMAF offers a special mode, called No Enhancement Gain. This is described in the following blog post.
- XPSNR: the logarithmic XPSNR output values are in a similar range as those of traditional PSNR assessments but better reflect human impressions of visual coding quality.
- APSNR: this is an aggregate metric - we calculate MSE over all frames in a stream to get a single PSNR value.
Working With AV2
If you wish to work with AV2 (currently under development) in VQ Probe, we highly recommend using the dynamic library that was used to encode your AV2 files.
To change the default libaom dynamic library, simply copy your version of the library to:
- Windows: the root folder of your VQ Probe package
- Linux: the lib folder of your VQ Probe package
- macOS: the VQProbe.app/Contents/Frameworks folder
Using Intel(R) CM and OpenCL Calculation Modes
If you want to use Intel(R) CM for metrics calculation, you need the following:
- On Windows 10:
- Intel(R) UHD Graphics controller
- On Linux:
- Intel(R) UHD Graphics controller
- Intel(R) UHD Graphics drivers
- libva 2.0+, libdrm, libcmrt 7.2. You can get them by running
apt install -y libdrm-dev libva-dev libcmrt-dev
If you want to use OpenCL for metrics calculation, you need the following:
- On Windows 10:
- Graphics controller drivers with OpenCL support
- On Linux:
- OpenCL ICD. You can get it by running
apt install libOpenCL - Graphics controller drivers with OpenCL support. Find more here
- OpenCL ICD. You can get it by running
Activation
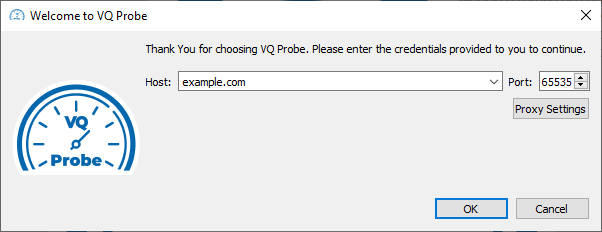
When you launch VQ Probe for the first time, you will be asked to enter credentials provided to you with your copy of the application. Enter the given IP (or domain name) and port to register your copy of VQ Probe. This is only needed once.
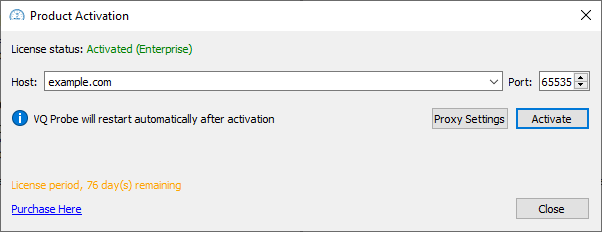
If you want to upgrade your copy of VQ Probe, go to Help > Activate, enter your new credentials, press the Activate button, and restart the application.
VQ Probe will check for updates every time you launch it. If a new version is available, a dialog window will show up. You may either update your VQ Probe or skip the dialog.
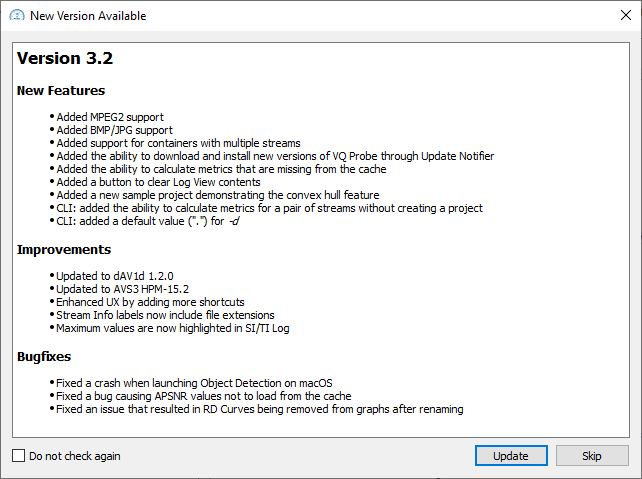
If you don’t want to see this dialog again, you can turn off automatic update checks by clicking Do not check again in the bottom-left corner of the dialog window or by unchecking the Help > Automatic Update Checks menu item. You can always turn them back on by checking Help > Automatic Update Checks.
Proxy Settings
If you want to use either a system proxy or a manually set proxy, press the Proxy Settings button. A dialog will appear:
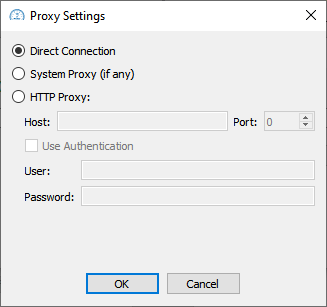
NOTE: If there is no system proxy, VQ Probe will not use any proxy (i.e. direct connection).
Graphical User Interface Overview
The main window of VQ Probe has the following elements:
- Project View
- Log View
- Playback View
- Metrics View
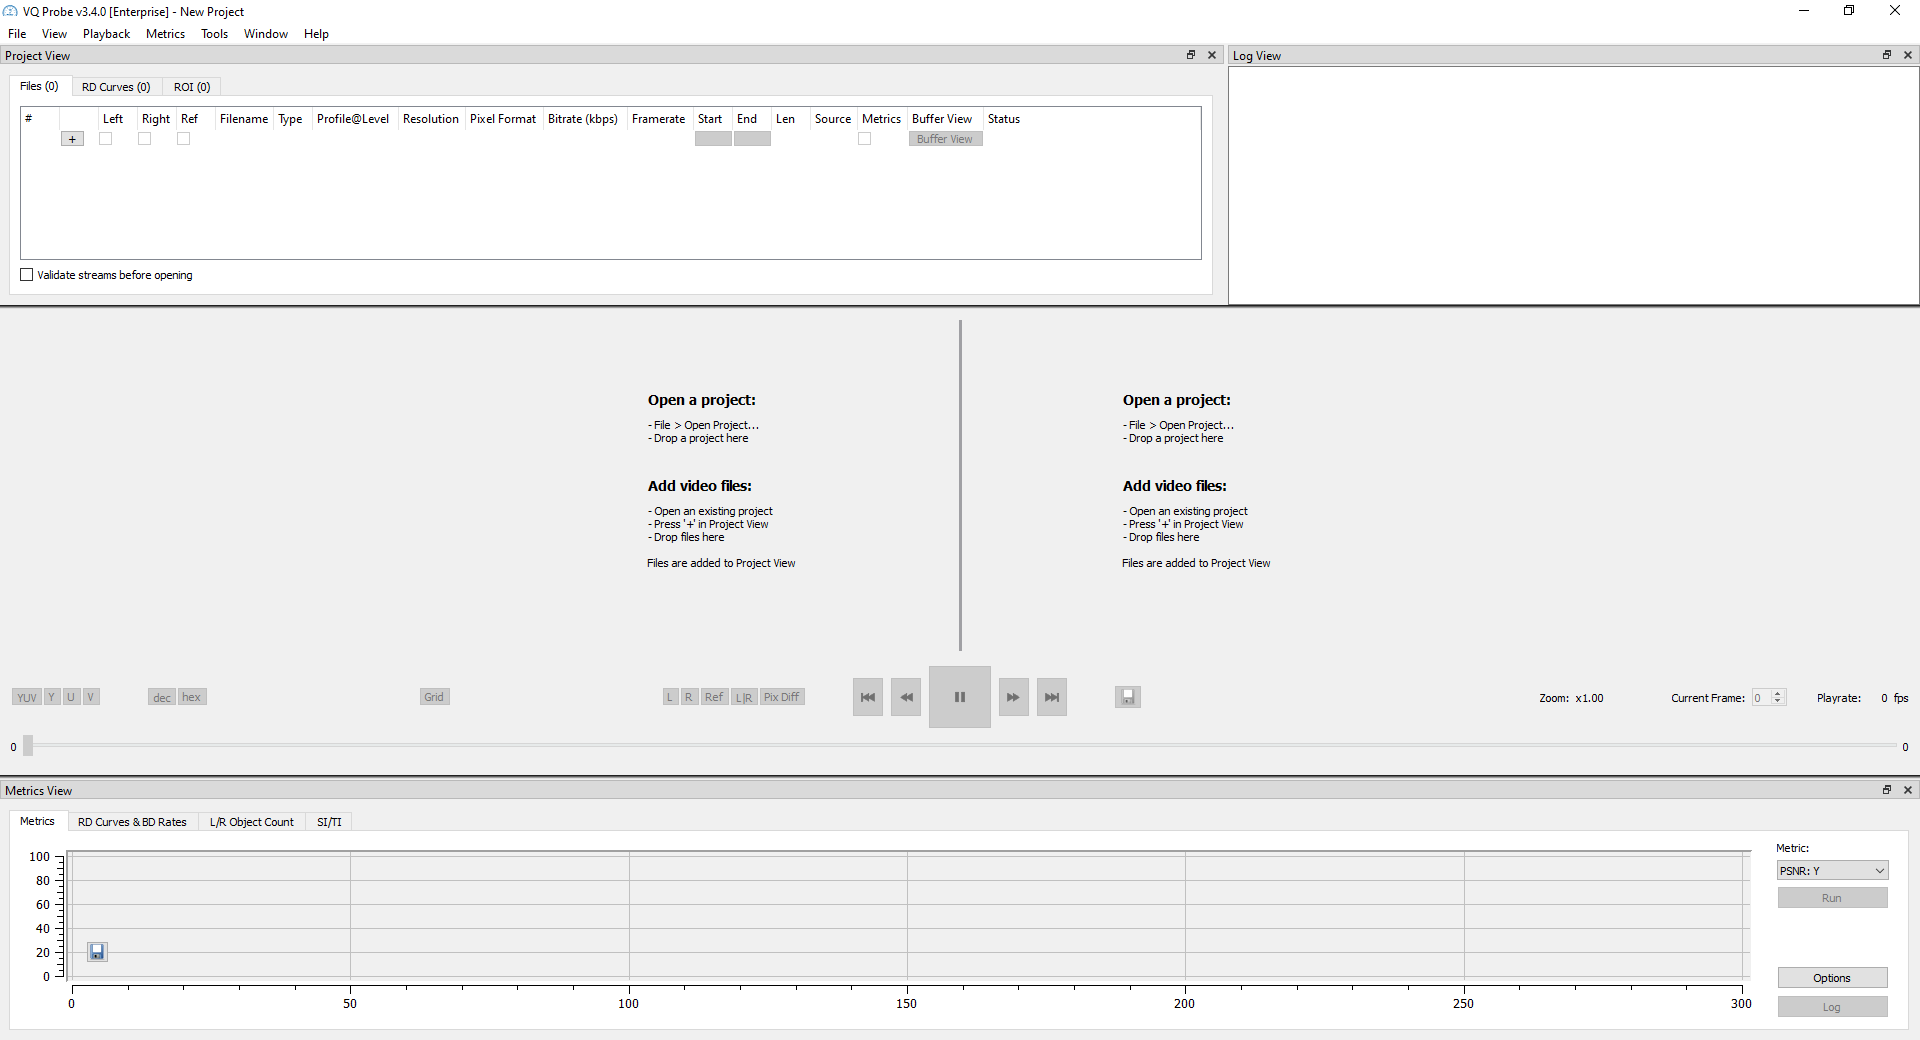
Project View
The view is used to set up and manage your workspace: add and remove source files, select which ones will be displayed in Playback View, create and remove RD Curves, set the RD Curve anchor used for BD Rate calculation, set up ROIs for the project.
Project View can be shown or hidden by using Window > Project View from the main menu, or by using hotkeys (Ctrl + Shift + P on Windows and Linux, or Cmd + Shift + P on macOS).
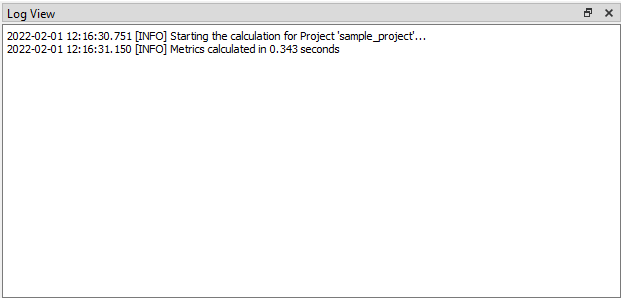
Log View
The view is used to observe various log messages (info messages, warnings, errors, etc.).
These and other log messages are also available via the log file (VQProbe.log). You can find it in the following folder: Windows/Linux – the logs folder in your application’s folder; macOS – Home/Library/Logs/VQ Probe.
You can clear contents of Log View by pressing the right mouse button and choosing Clear Log View in the opened context menu. You can also go to Tools > Options > General to make the Clear button visible. Pressing this button will also clear contents of Log View.
Log View can be shown or hidden by using Window > Log View from the main menu, or by using hotkeys (Ctrl + Shift + L on Windows and Linux, or Cmd + Shift + L on macOS).
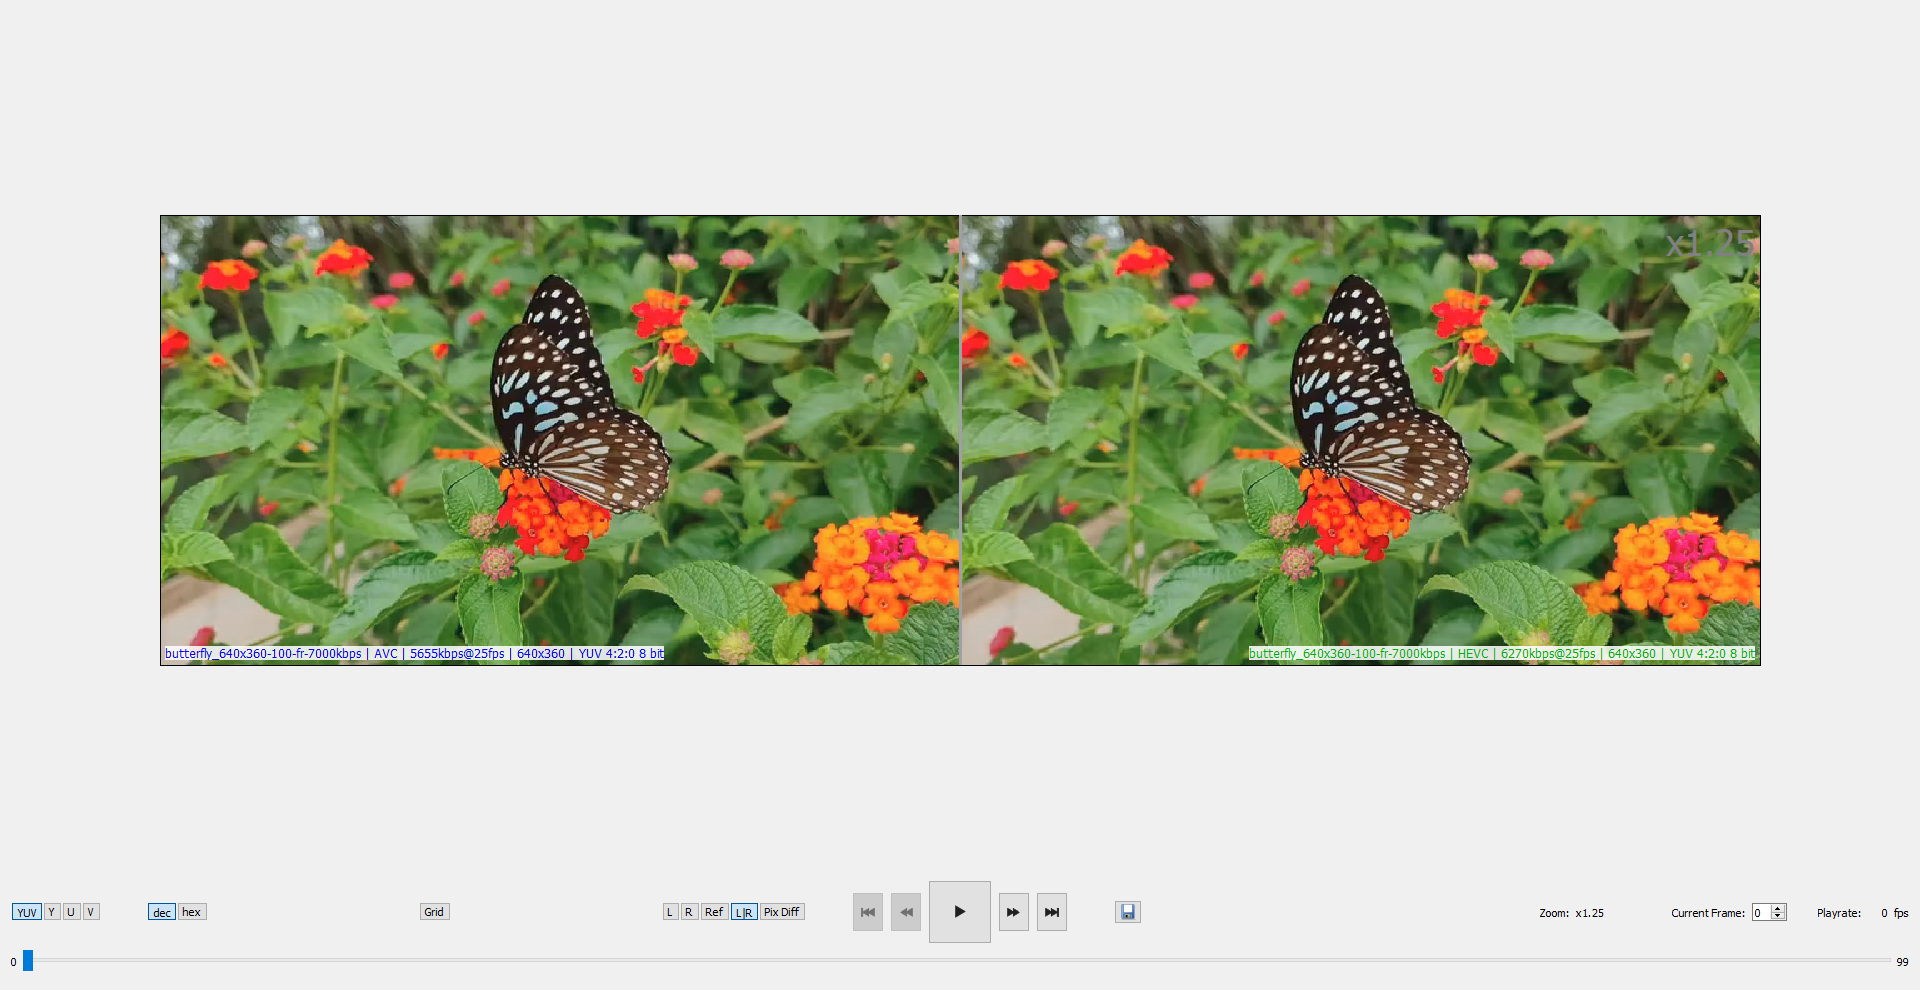
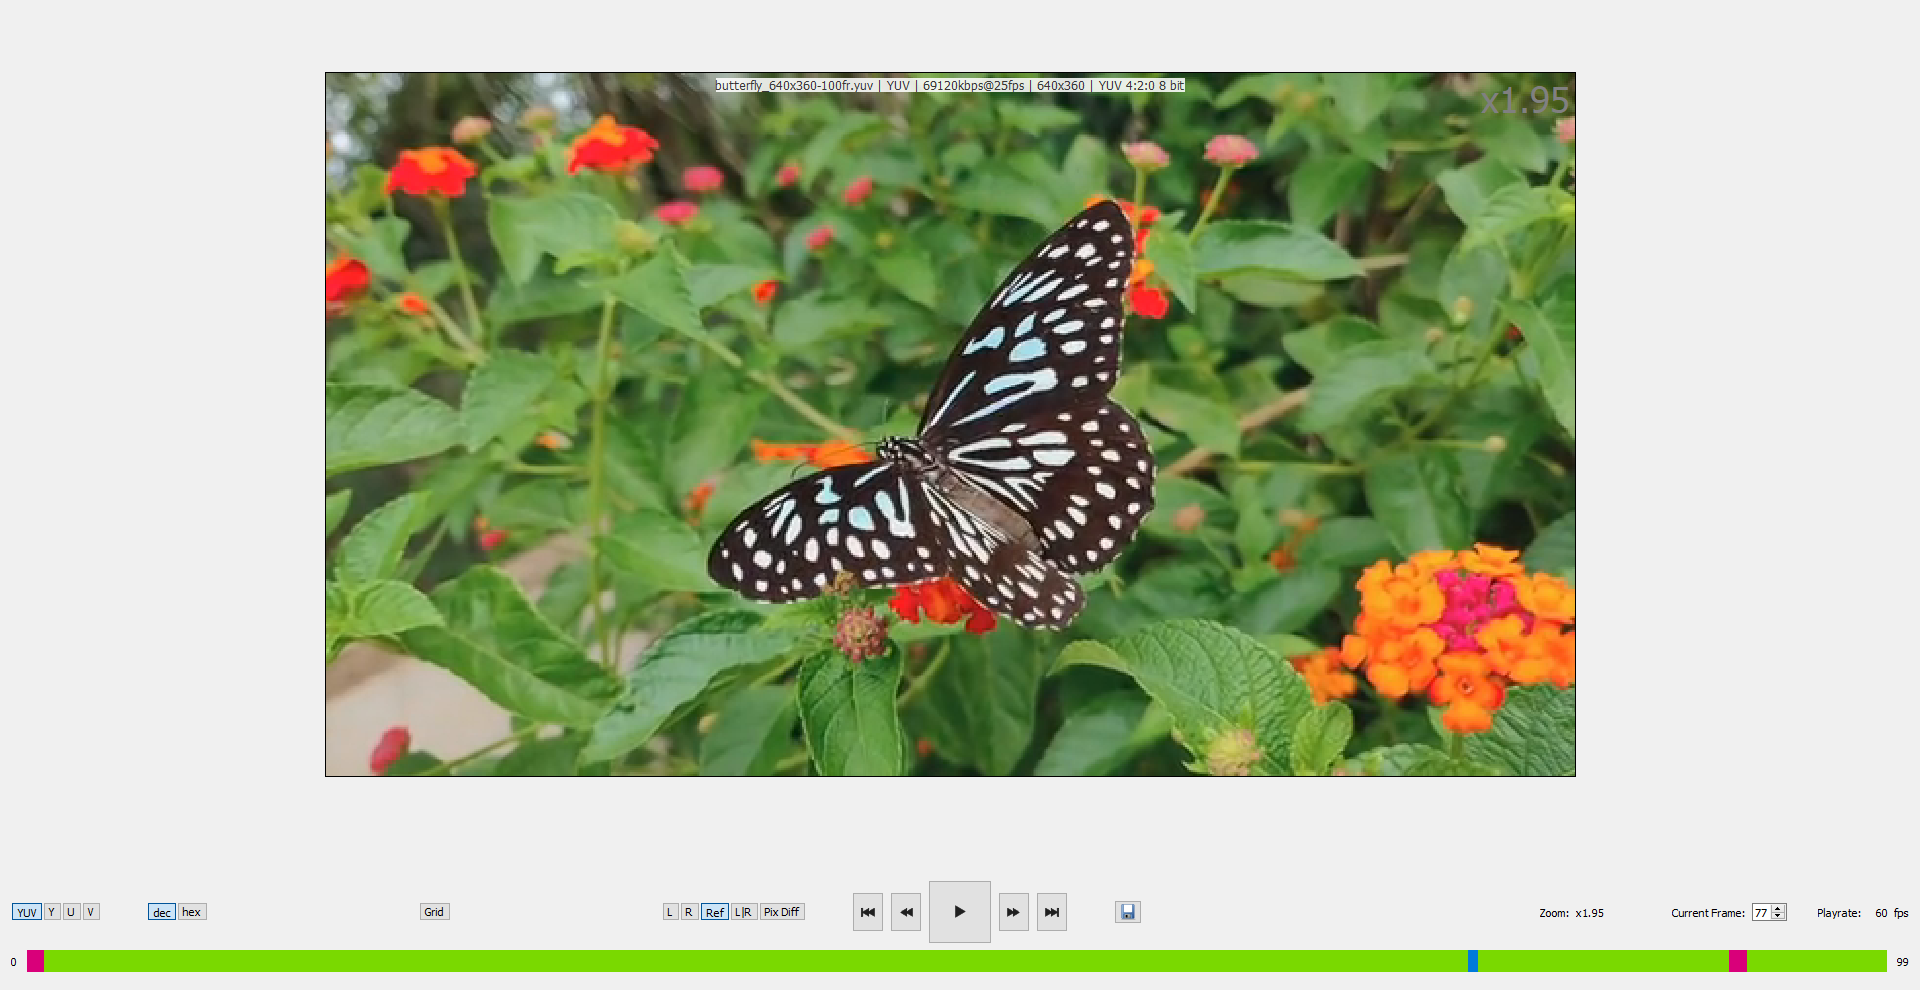
Playback View
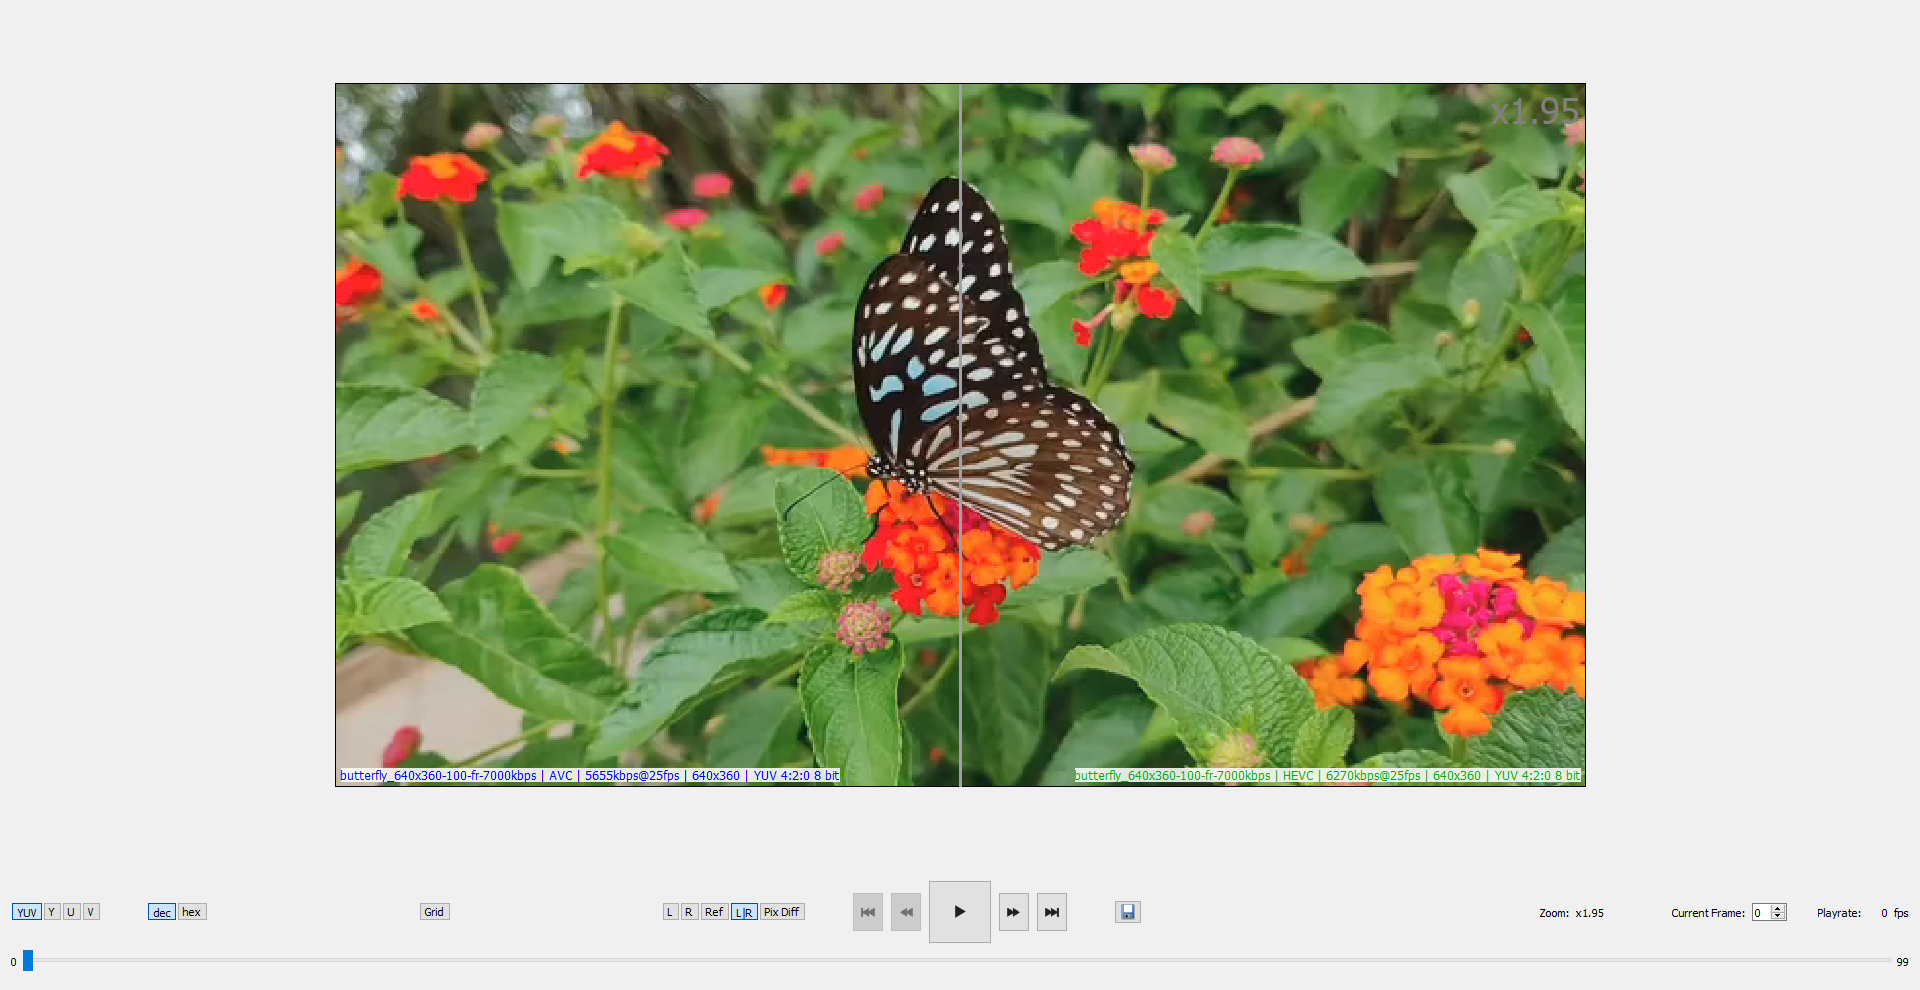
- Left file area displays a part of the current frame of the left file
- Right file area displays a part of the current frame of the right file
- Vertical split line allows the user to change the width of Left/Right frames
- Buttons to choose which components are shown:
- YUV: show YUV
- Y: show only Y plane
- U: show only U plane
- V: show only V plane
- Buttons to choose the format of numbers in Playback View
- dec: show numbers as decimal
- hex: show numbers as hexadecimal
- Grid overlay:
- Grid: show the grid overlay
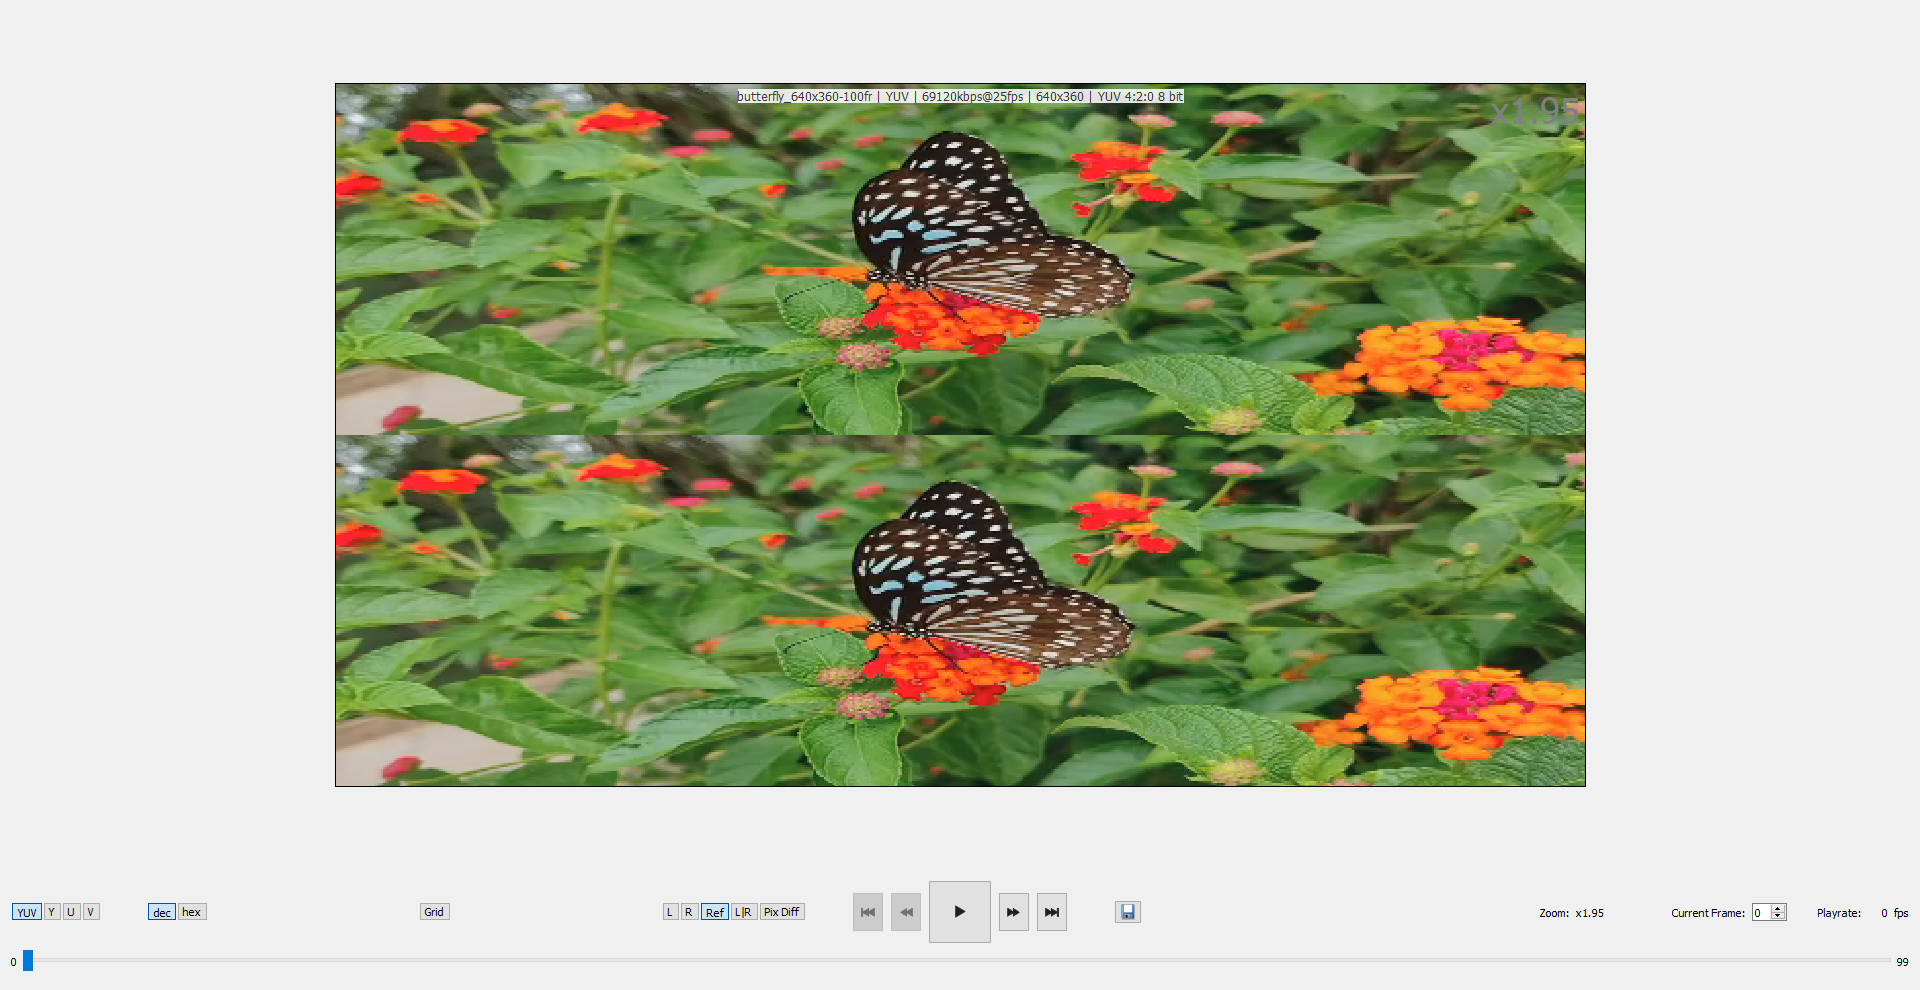
- View mode:
- Left: show the left file
- Right: show the right file
- Ref: show the reference file
- L|R: show Left and Right divided by the split line
- Pix Diff: show the difference between Left and Reference on the left side of the screen and the difference between Right and Reference on the right side of the screen
- Navigation buttons:
- First Frame: go to the first frame
- Previous Frame: go to the previous frame
- Play/Pause: start playback or pause, respectively
- Next Frame: go to the next frame
- Last Frame: go to the last frame
- Miscellaneous buttons:
- Save Frame: save the current frame
All buttons are duplicated by the appropriate items in the View and Playback menus. Hotkeys are also available for the buttons listed above. Please follow the main menu for exact hotkeys depending on the Operating System you use.
Use the slider or the Current Frame spinbox to navigate to a desired frame.
If you hover your mouse over the frame, you will see the mouse coordinates (in pixels) in the upper left corner.
NOTE: The left or right area might not display any frame after navigation. This means that there is no corresponding frame in the appropriate file while the other file has a frame with the same frame number. This happens if opened files have different numbers of frames.
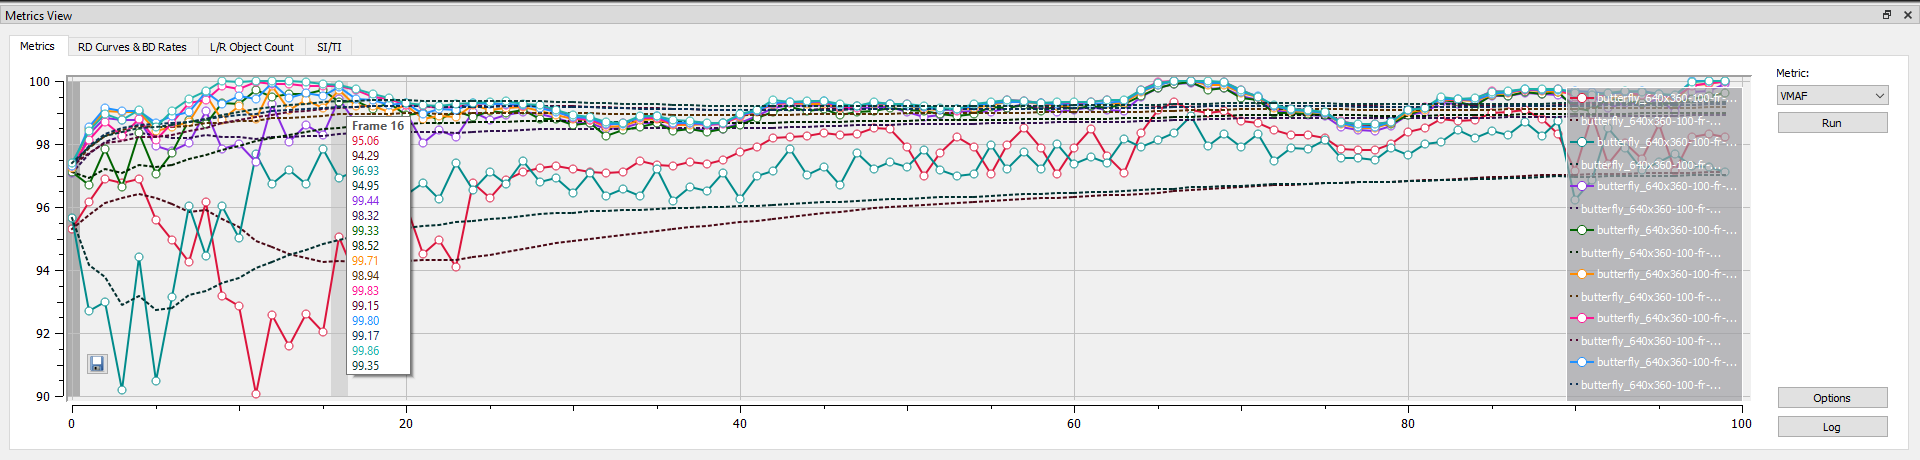
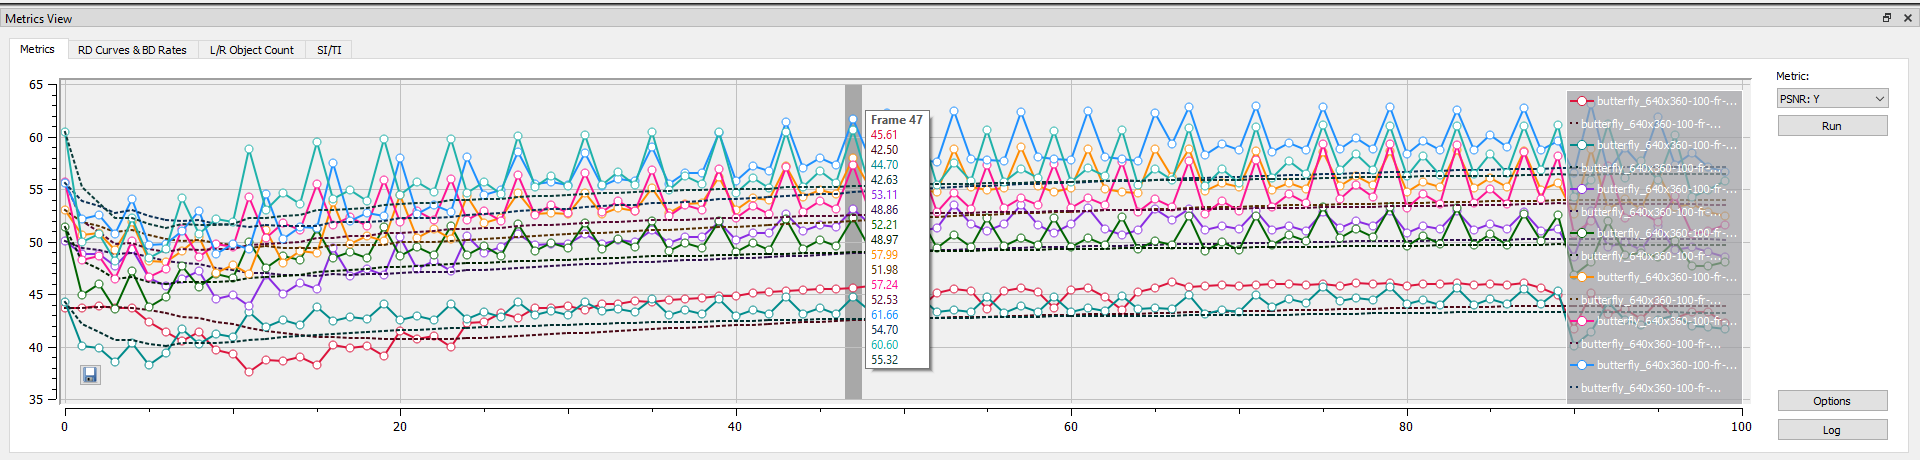
Metrics View
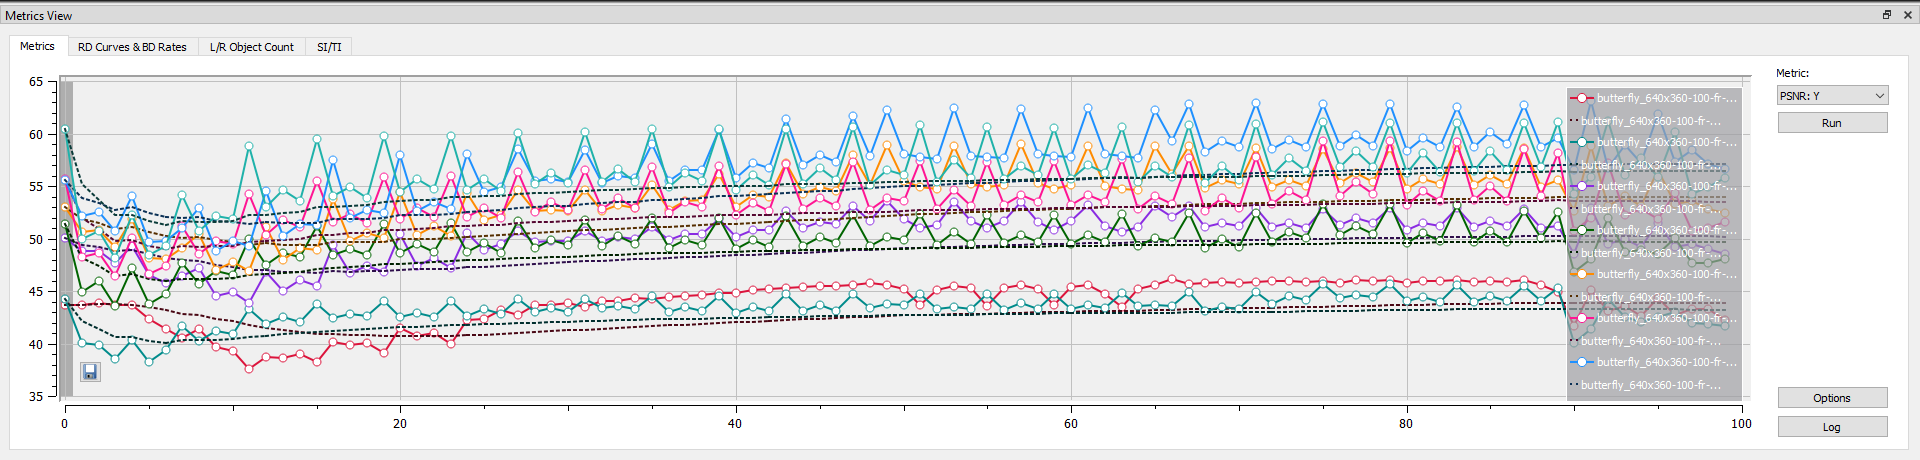
The view consists of the following elements:
- Four tabs:
- Metrics: contains regular metrics values for each file
- RD Curves & BD Rates: contains RD Curves (if exist) as well as BD Rate information
- L/R Object Count: shows the number of objects found for Left and Right
- SI/TI: contains SI and TI values for every stream (including Reference)
- The Metric combo-box to choose a metric to display on Metrics View. It could be one of the following:
- PSNR: Y, PSNR: U, PSNR: V, PSNR: YUV
- SSIM
- VMAF, CAMBI, CIEDE2000, MS-SSIM, PSNR-HVS, VMAF-NEG
- XPSNR
- The Run/Stop buttons are to start or stop, respectively, metrics calculation
- The Options button to open the Common Metrics tab of the VQ Probe Options dialog.
- The Log button to show the Metrics Log
The Run button is disabled if a reference file is not opened. Once the user clicks the Run button, it is replaced by the Stop button. And vice versa: once the user clicks Stop, or when the metrics calculation process is done, Run appears again, and replaces the Stop button.
Metrics View can be shown or hidden by using Window > Metrics View from the main menu, or by using hotkeys (Ctrl + Shift + M on Windows and Linux, or Cmd + Shift + M on macOS).
Functionality
Project
Once VQ Probe is launched, it has an empty project by default. You may open a project saved before, or you can set up the project for your needs from scratch. To do so, start by adding source files.
NOTE: VQ Probe also provides a sample project. Go to File > Samples to find it.
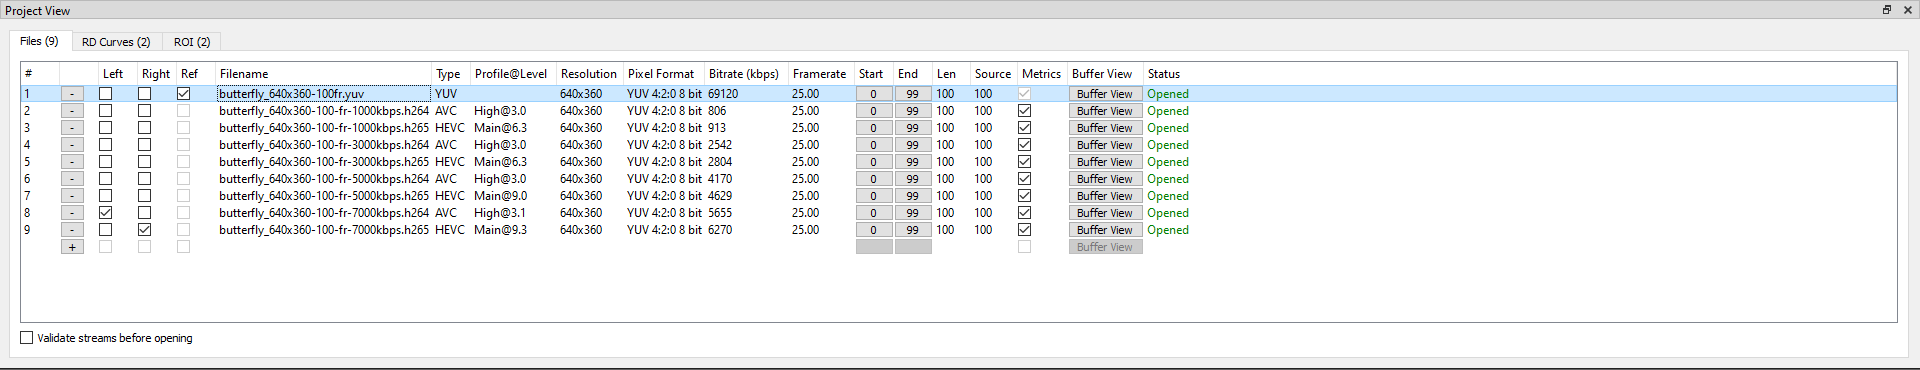
Add Source Files
By source files we assume video files that are used in analysis and metrics calculation, as well as any other operations within VQ Probe. These could be uncompressed files as well as encoded files.
Source files can be added to the current project in several ways:
- Via the File > Add Files menu item
- By pressing the + button on the Files tab of Project View. The standard “Open Files” system dialog will be opened. Select one or more files and press the Open button.
- By dropping files on Playback View. Files will be added to Project View.
One of the possible reasons why a file cannot be added is that its format is not supported. Please check this section for the list of supported formats.
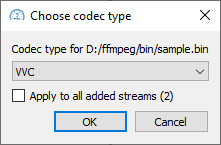
If a file's extension is unknown to VQ Probe, you will be asked to choose the desired codec type from the list of supported codecs. If you open multiple files, a checkbox will appear allowing you to apply the selected codec type to all files.
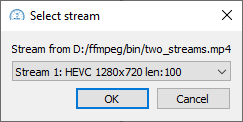
If a container has more than one stream, you will be asked to choose the desired stream from the list of this container's streams.
The first added file will be set as Left, the second file as Reference, and the third as Right. All other files will be simply added to Project View.
NOTE: If there is no reference file, any added YUV/Y4M file will be set as Reference.Now, when files are successfully opened, their information is displayed on the screen: codec, profile and level, resolution, pixel format, bitrate, framerate (the default value is 25), and frame count.
Use checkboxes from the Left, Right, or Ref columns to set the appropriate file to be displayed as Left, Right, or Reference, respectively, on Playback View:
You can drag added files with the mouse to change their order in the list.
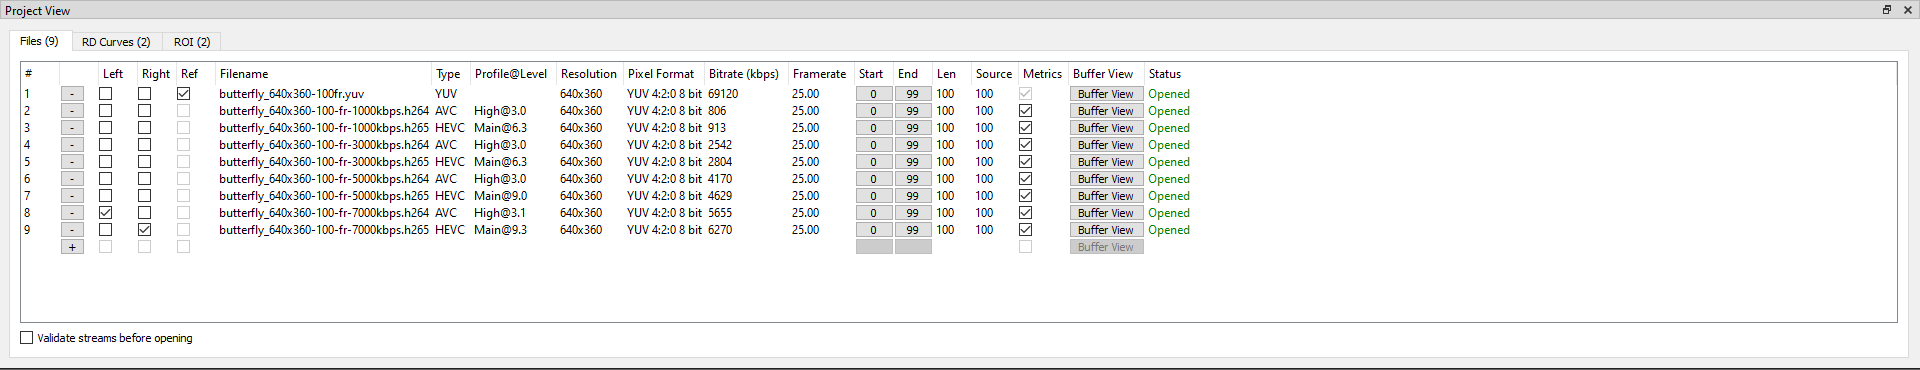
By default, the Validate streams before opening checkbox is unchecked. Check it if you want to make sure that files are valid (e.g. has constant resolution and pixel format), but note that this may result in slower file opening.
Remove Source Files
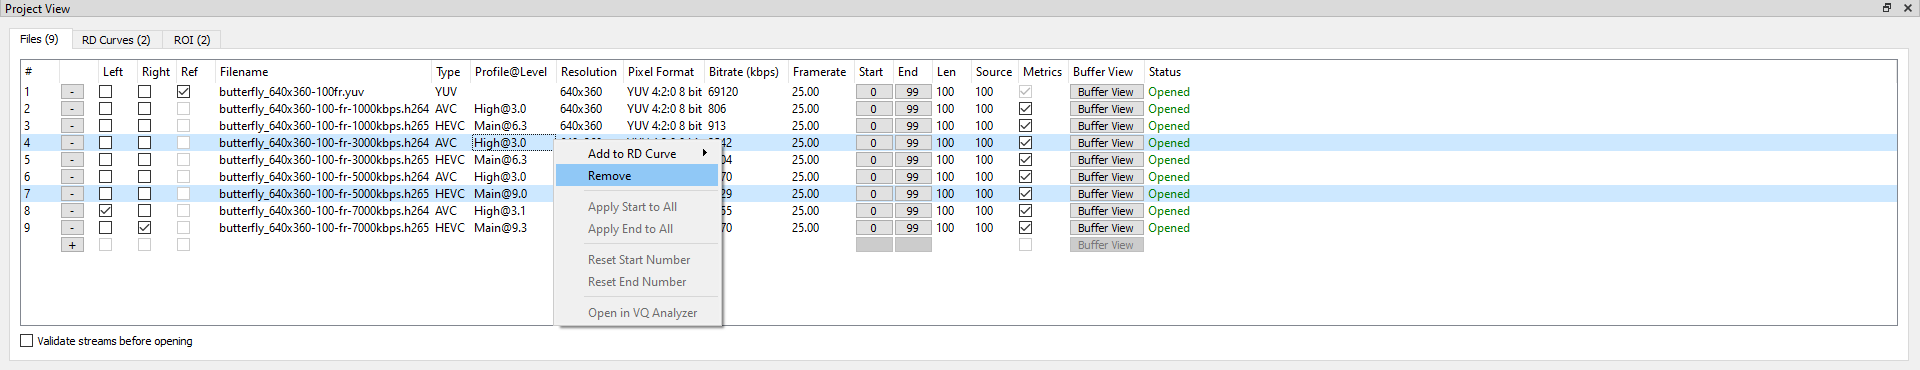
Select one or more files from the list on the Files tab and press the right mouse button. In the opened menu choose Remove.
Opening YUV/RGB Files
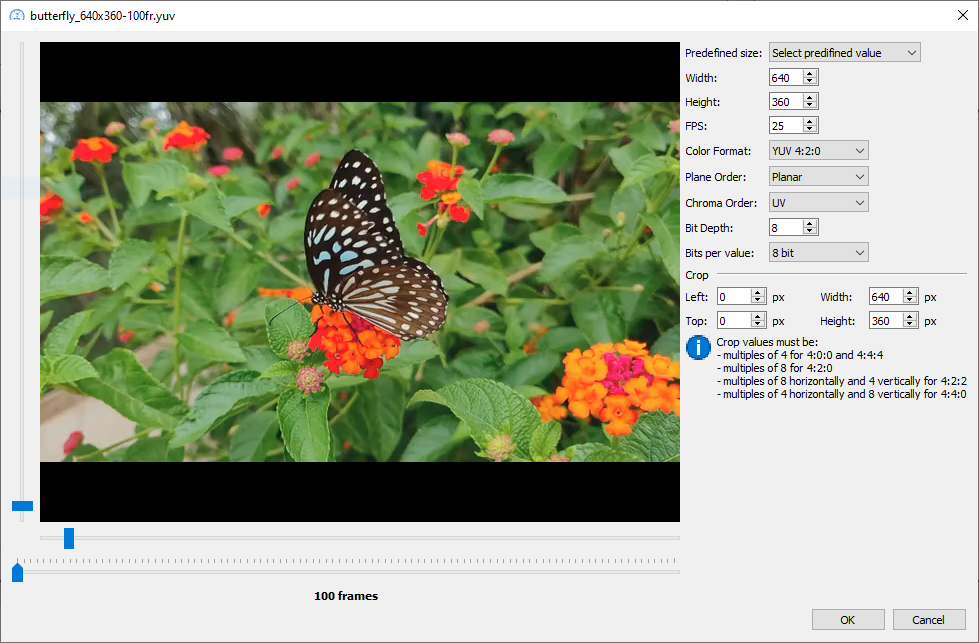
Y4M files are opened automatically. In case of a regular YUV/RGB file, the user will be asked to specify video parameters, such as resolution, chroma subsampling, bit depth, and so on.
Configure parameters of the file. Once a parameter is changed, the preview image updates. This way you can tune parameters until the image looks right to you.
NOTE: Once the user opens a specific file via the dialog, consequent openings of the same file will use the previous parameters as the default parameters.
Crop
For YUV/Y4M files you have the option to crop the image:
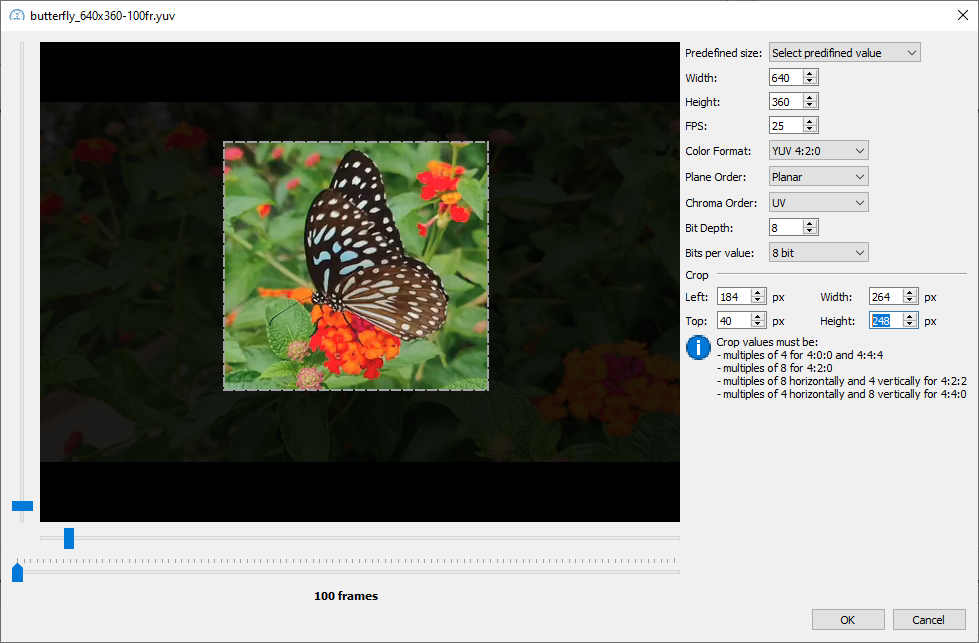
There are 4 parameters to set up cropping:
- Left: position in pixels where to start cropping horizontally
- Top: position in pixels where to start cropping vertically
- Width: width of the cropped area in pixels
- Height: height of the cropped area in pixels
Once any of these parameters are changed, the visualization of the cropped area will be updated on the left side of the dialog.
NOTE: Cropping parameters will be automatically changed to the nearest multiple of 4 or 8 depending on the Plane Order. You may find the details under the information sign of the dialog.NOTE: Cropping is not available for RGB streams.
Trim
You can trim source files by clicking on the Start or the End column for a specific source file. A dialog with a spinbox will appear:
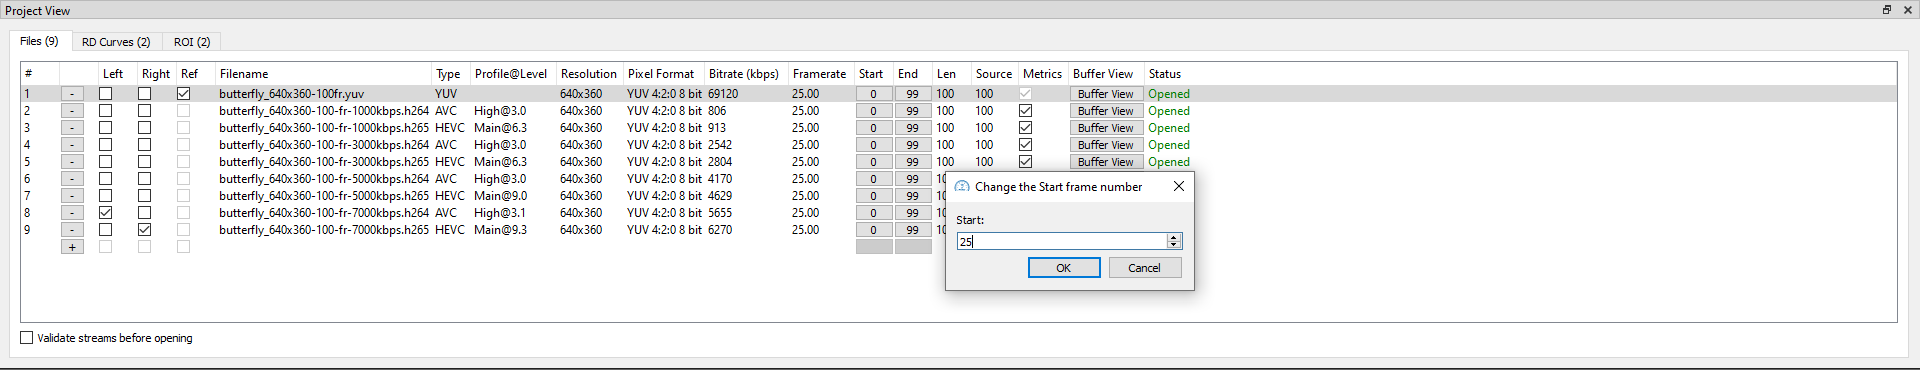
Type in or select a required frame number and click OK. The value will be changed.
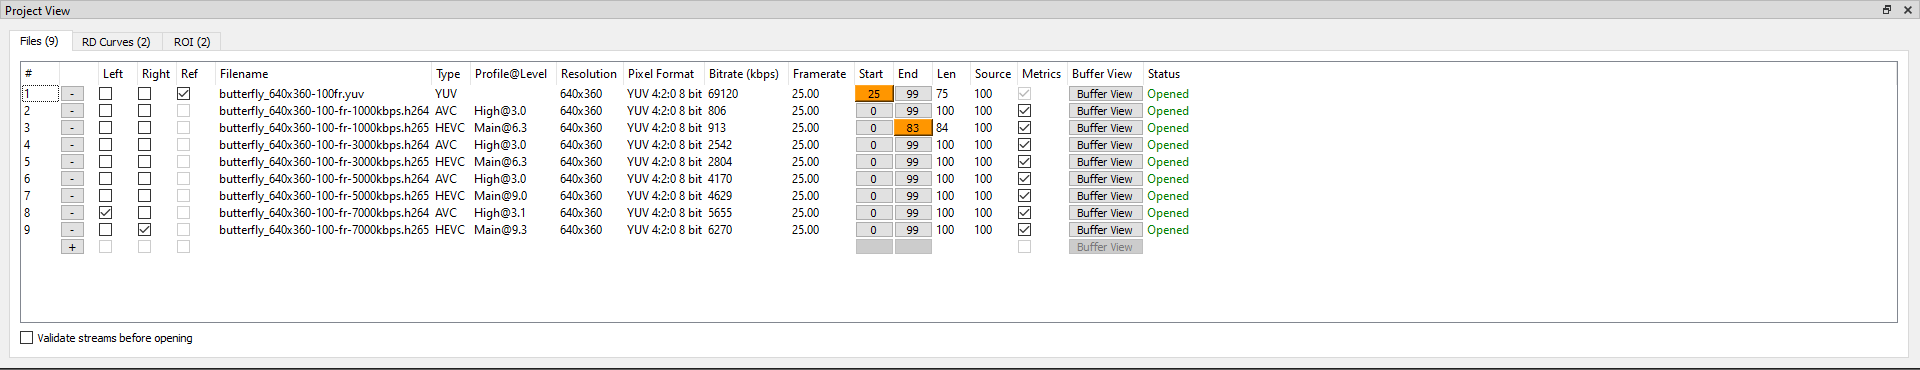
All Start/End frame numbers that have been changed are marked in orange:
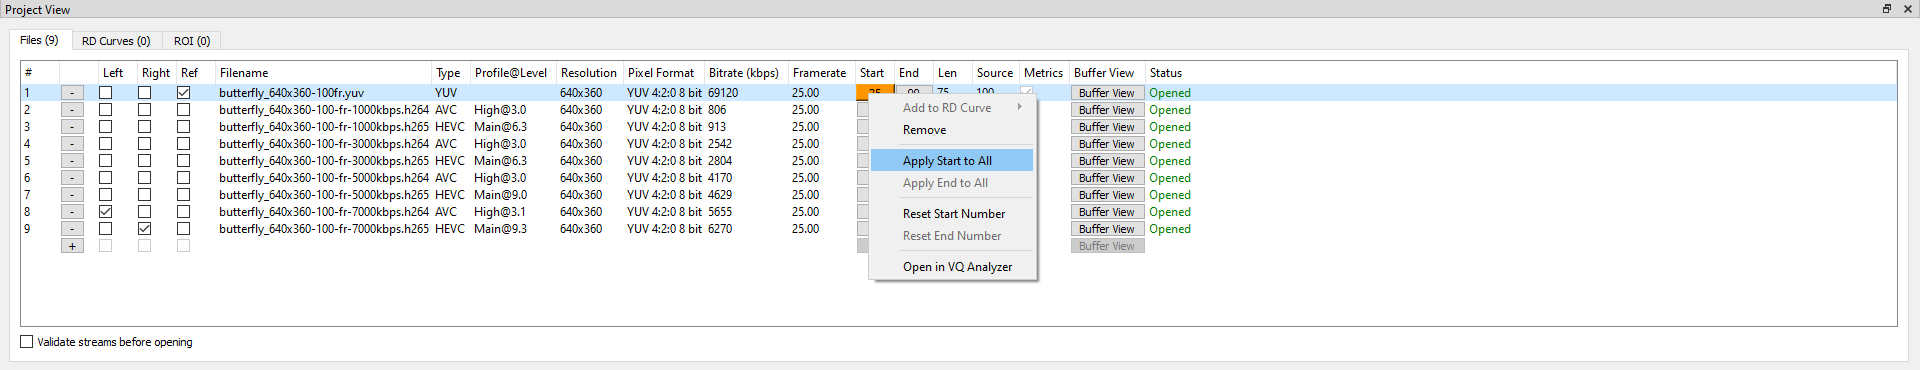
You can apply trimming to all source files. To do that, press the right mouse button on the Start or the End column for a specific source file and then choose either Apply Start to All or Apply End to All:
Once the option is selected, all the files will be trimmed:
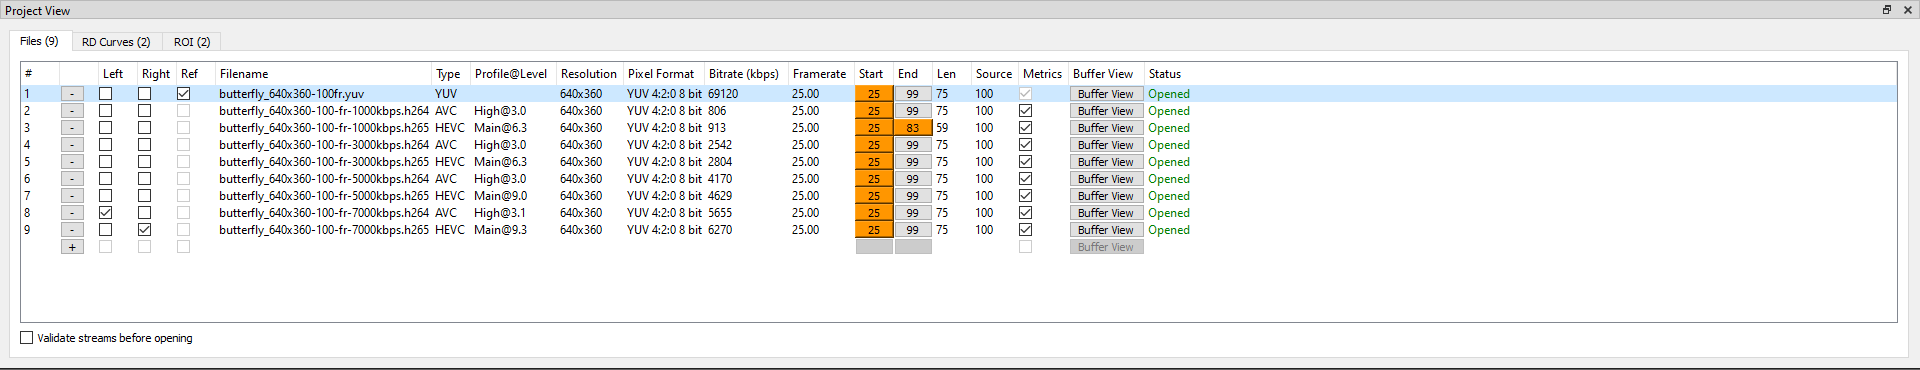
NOTE: Trimming source files will affect the frame numbering used in Playback View and Metrics View. For example, if a source file has been trimmed and now starts from Frame 10, then the frame marked as Frame 0 in Metrics View will correspond to Frame 10 from the original source file.
Disable Metrics
You can disable metrics for some stream(s) by unchecking the Metrics checkbox.

Metrics for such streams will not be calculated, but the streams themselves will not be removed from the project.
NOTE: Metrics cannot be disabled for reference files. If a stream is set as Reference, metrics will be automatically enabled for this stream.
Buffer View
Buffer View presents frame sizes of a file. This is a bar chart plotted with frame sizes. Each bar is colored according to the frame type.
Press the Buffer View button for a specific source file to open a separate window with Buffer View.
NOTE: It may take some time to initialize the bar chart.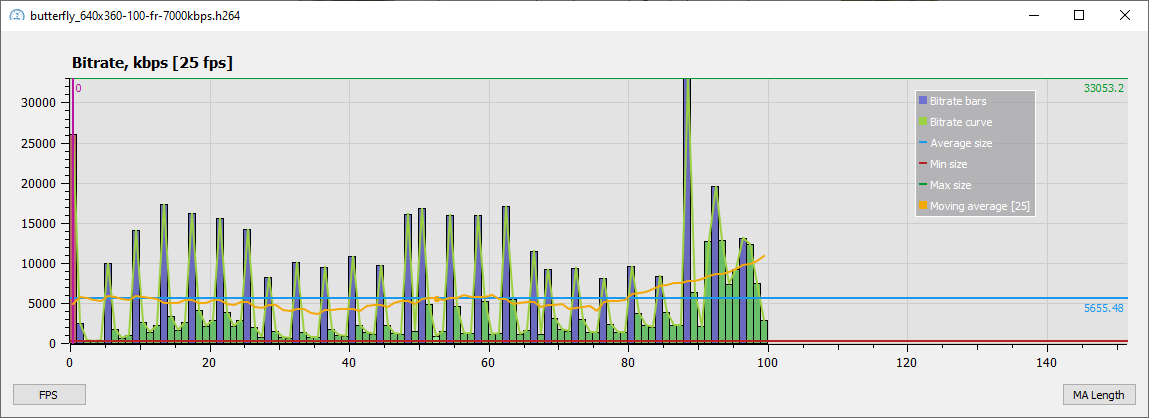
Move the mouse over a bar to get a tooltip with information about a frame represented by this bar. The current frame of Playback View is shown with a vertical line and a frame number on it.
Hover your mouse over one of the axes and scroll the mouse wheel to change the scale. Double-clicking on an axis resets it.
Click the FPS button to adjust the current framerate. Click the MA Length button to change the Moving Average length.
You can move the legend by pressing the left mouse button and moving the mouse. You can also click one of the legend items to show or hide the corresponding bar/curve. Click the right mouse button to restore the default position of the legend.
NOTE: Frames appear in decoding order. Every tooltip of a bar starts with two numbers: x/y, where x is the frame number in decoding order, and y is the frame number in display order.
Open In VQ Analyzer
You can open a source file in VQ Analyzer. To set the VQ Analyzer path, go to Tools > Options > General.
Select a source file from the list on the Files tab and press the right mouse button. In the opened menu choose Open in VQ Analyzer.
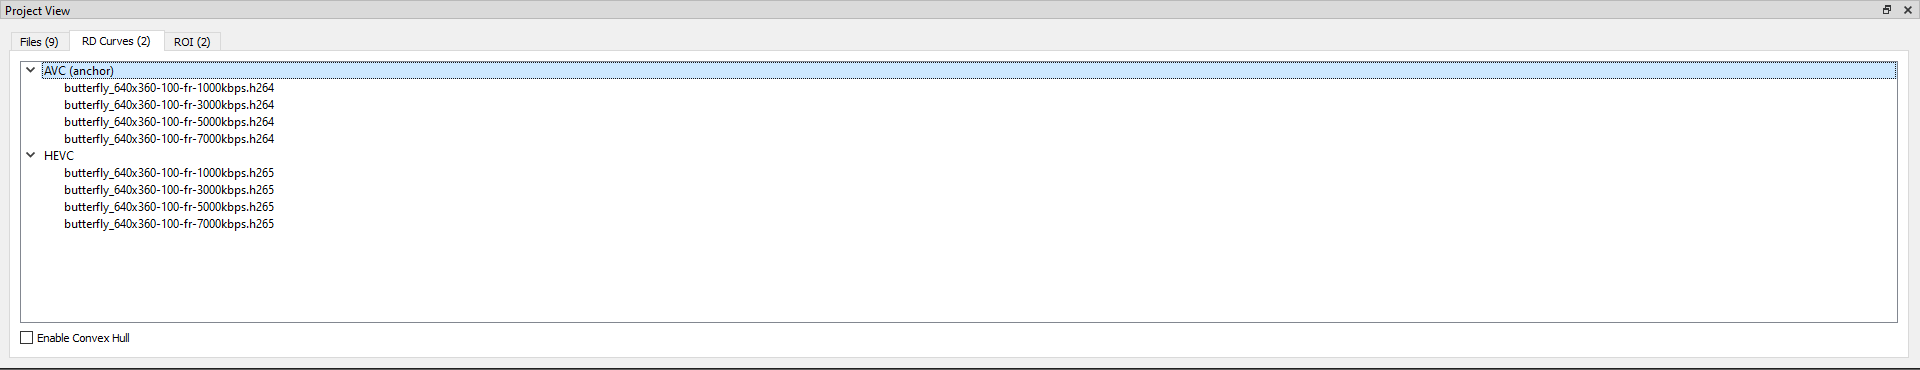
Create RD Curves
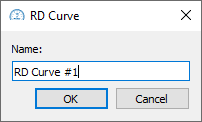
Press the right mouse button at any empty space or on any RD Curve item on the RD Curves tab. Choose Add RD Curve from the opened menu. Enter a name for a new RD Curve and press OK.
You cannot choose the name of any existing RD Curve. You cannot either choose the name of any pre-existing RD Curve. In both cases, you will be prompted to choose another name.
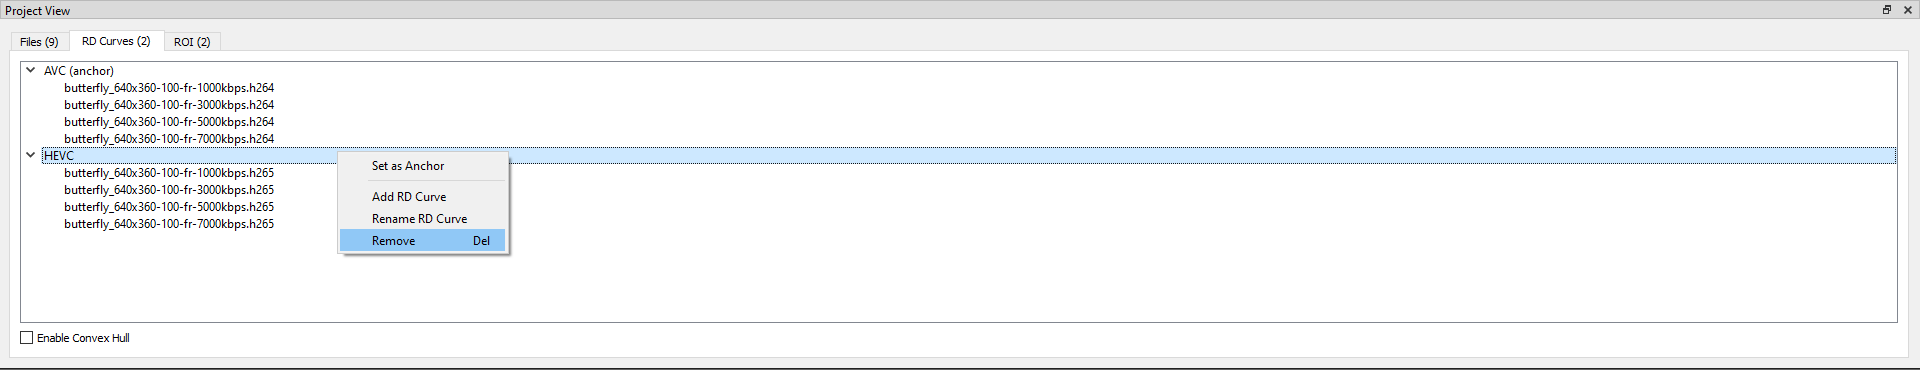
Remove RD Curves
Press the right mouse button on one or more RD Curves on the RD Curves tab, then choose Remove from the opened menu.
Add Source Files To RD Curve
Select one or more source files on the Files tab, click the right mouse button, then select the Add to RD Curve menu item. You will see a list of RD Curves to which the selected source files can be added:
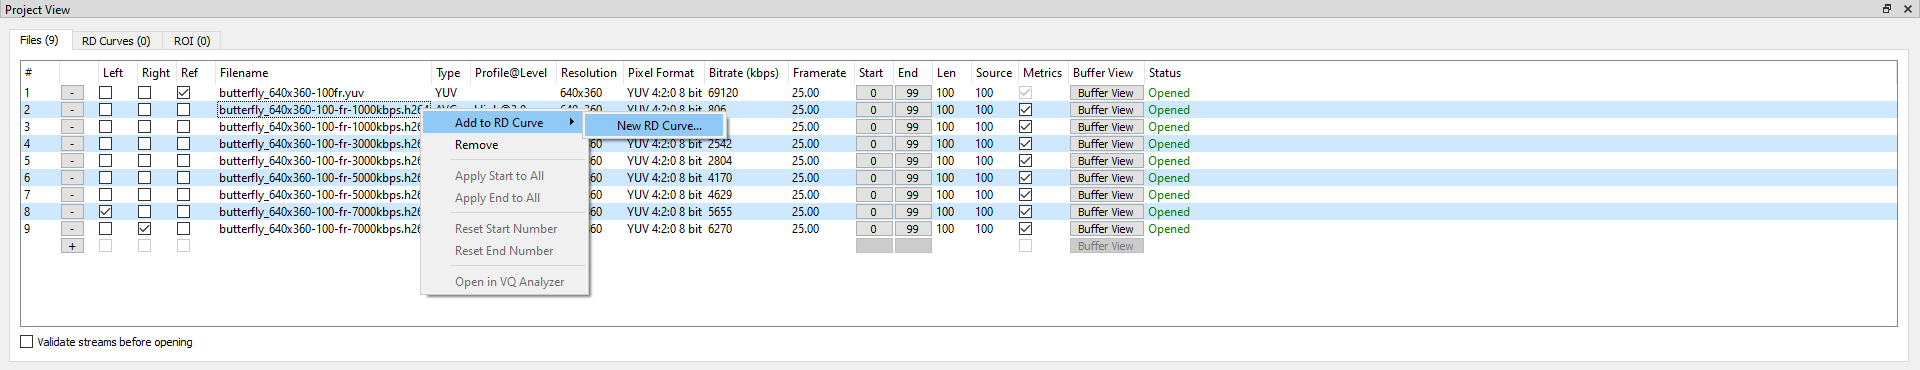
NOTE: A reference file cannot be added to an RD Curve. YUV files cannot be added as well.Once you add source files to an RD Curve, they will appear in the list of RD Curves.
VQ Probe can also add streams to RD Curves automatically. To set the RD Curves Auto Mode, go to Tools > Options > General.
Move Source Files Between RD Curves
You can drag source files between RD Curves. The dragged files will be deleted from the original curve and added to the new one.
Remove Source Files From RD Curve
Choose one or more source files, press the right mouse button, and choose Remove:
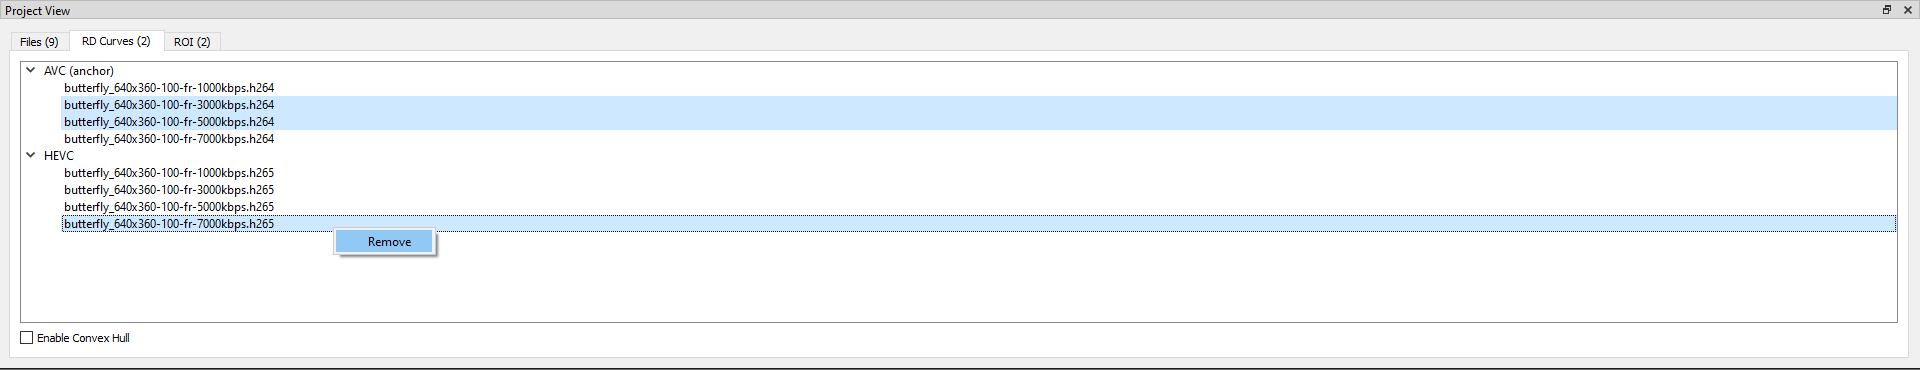
All the selected source files will be removed, even if they are referring to different RD Curves.
Set RD Curve As Anchor
An anchor RD Curve is used for BD Rate calculation. BD Rates will be calculated for all other RD Curves relative to the anchor RD Curve.
To mark an RD Curve as the anchor, select that RD Curve and press the right mouse button. Once marked, its name will be changed:
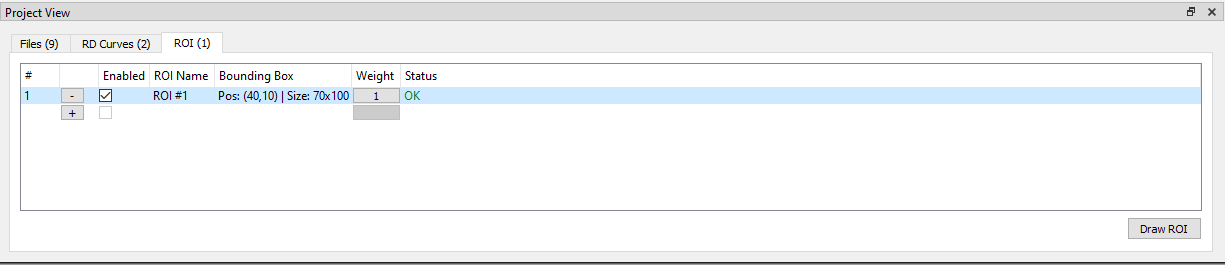
ROI Tab
A region of interest (or ROI) is a rectangle set for all streams in a project, which is used to calculate metrics (that is, metrics are calculated only for this region).
VQ Probe accepts files in the COCO JSON format. We are using the annotations/bbox field to set ROIs; read this specification for more information.
Here is an example of a ROI file (found here: Windows/Linux – the samples/sample_project folder in your application’s folder; macOS – VQProbe.app/Contents/SharedSupport/samples/sample_project):
{
    "annotations": [
        {
            "bbox": [
                40, // top X coordinate
                10, // top Y coordinate
                70, // width
                100 // height
            ]
        }
    ]
}
Use the + button to specify ROI files. All ROIs from these files will be added to the list.
Click the - button to remove a ROI from the table.
Check the ROIs you want to use in your calculation. You can select any number of ROIs. You can also set weights for your ROIs.
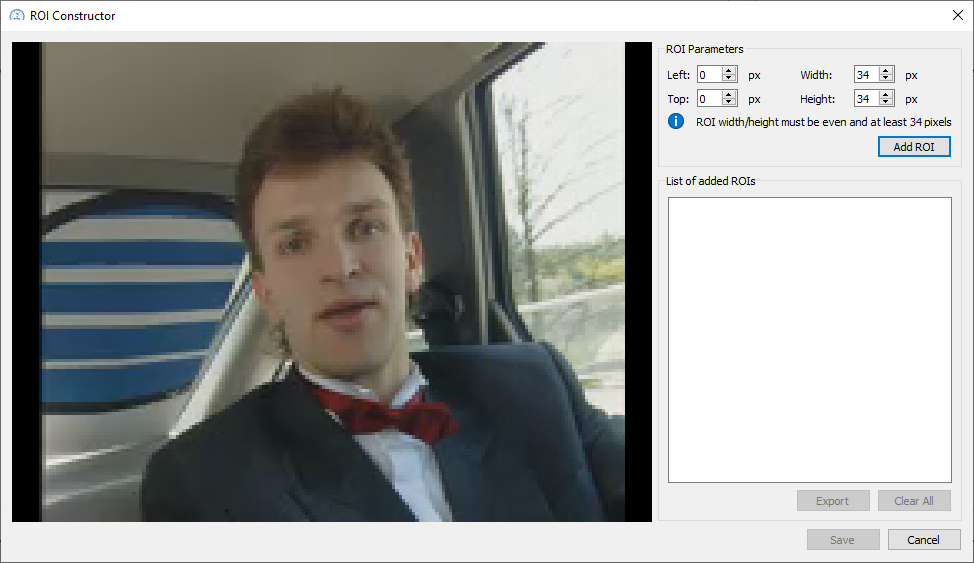
You can also draw ROIs manually via the ROI Constructor dialog. Press the left mouse button, then hold it and move the mouse to draw a desired ROI (it will have green color). While a ROI is green, you can adjust it using the spinboxes. To add this ROI to the list of added ROIs press the Add ROI button. Added ROIs have red color.
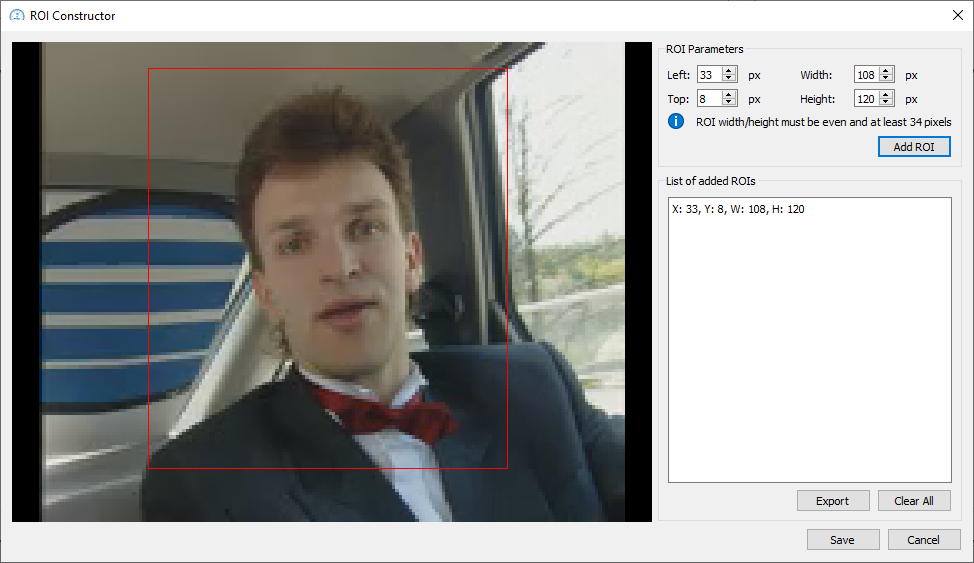
Use the Export button to save ROIs added to the list to a COCO JSON file. The Clear All button will clear the list of ROIs.
Click the Save button to add ROIs to the current project. Clicking the Cancel button will clear all ROIs and close the dialog.
Please note that a region of interest must be a valid rectangle that completely fits into the frame rectangle. Its width and height must be even and at least 34 pixels long. The maximum ROI size is determined by the resolution of the smallest stream in a project. If a ROI is invalid, it will appear highlighted in red in the table.
Please note that ROIs are set for a project; when you close the current project, the current ROIs will be reset.
File With Multiple ROIs
Here is an example of a file with multiple regions of interest. These ROIs can be applied to the sample project.
{
    "annotations": [
        {
            "bbox": [
                0,
                0,
                88,
                72
            ]
        },
        {
            "bbox": [
                88,
                72,
                88,
                72
            ]
        },
        {
            "bbox": [
                0,
                72,
                88,
                72
            ]
        },
        {
            "bbox": [
                88,
                0,
                88,
                72
            ]
        }
    ]
}
Playback
Playback can be started by clicking the Play button, by choosing the Playback > Play/Pause menu item, or by using the Space hotkey. To stop playback, press the Pause button, choose the Playback > Play/Pause menu item, or use the Space hotkey.
Playback can be looped by checking the Playback > Loop menu item or by using the Ctrl + L hotkey. By default, playback is not looped.
Maximum playrate can be set to one of the predefined values listed in the Playback > Max Playrate menu. The default value is 25 fps.
NOTE: Depending on hardware resources, playrate can be less than targeted in the menu.
Overlap View / Independent View
By default, VQ Probe is in the Overlap View mode. You can switch to the Independent View mode. In this mode, Left and Right are shown in full, side by side, and the split line is not movable.
To change the current mode, click the View > Split Line Mode submenu and choose either Overlap View or Independent View. You may also use hotkeys: F6 for Overlap View or F7 for Independent View.
Field Split
VQ Probe allows the user to view frames as splitted fields.
By default, this mode is disabled. To enable the mode, click the View > Field Split Mode submenu and choose either Top Field First or Bottom Field First. You may also use hotkeys: F9 for Top Field First or F10 for Bottom Field First. To disable the mode use View > Field Split Mode > Mode Disabled or press F8.
NOTE: Field Split Mode does not work with RGB32 streams.
L|R Scale
If Left and Right streams have different resolutions, you can upscale or downscale one stream to match the resolution of the other. Go to View > L|R Scale Mode to choose one of three modes:
- No Scaling: no scaling is applied (this is the defaut option)
- Scale to Higher Resolution: upscales the lower resolution stream
- Scale to Lower Resolution: downscales the higher resolution stream
You can choose a scaling algorithm here: Tools > Options > General (see the Options section). The default algorithm is Lanczos with param[0] = 5; Bicubic have both params set to zero.
Zoom
Source files can be zoomed in as well as zoomed out. Following are the options:
- Choose the menu items View > Zoom In and View > Zoom Out to zoom in and zoom out, respectively
- Use the hotkeys. Specific key combinations depend on the Operating System the application is running on. You may find the exact combinations in the View menu.
- Press Ctrl and the left mouse button to start selection of the area to zoom in. The source file will be zoomed in once the mouse button is released
There are some additional convenient functions:
- change the size to the actual video resolution by using View > Actual Size
- fit a source file to the window’s size by choosing View > Fit to Window in the menu
Double-click on Playback View or use View > Reset to Default View to reset zoom, the position of the split line, and the position of the Grid widget (see below).
NOTE: In case when a source file is shifted from the center of Playback View, using the hotkeys may shift it even more.
Image Navigation Panel
If you zoom in, Image Navigation Panel becomes available. It is used to show what region you are currently looking at:
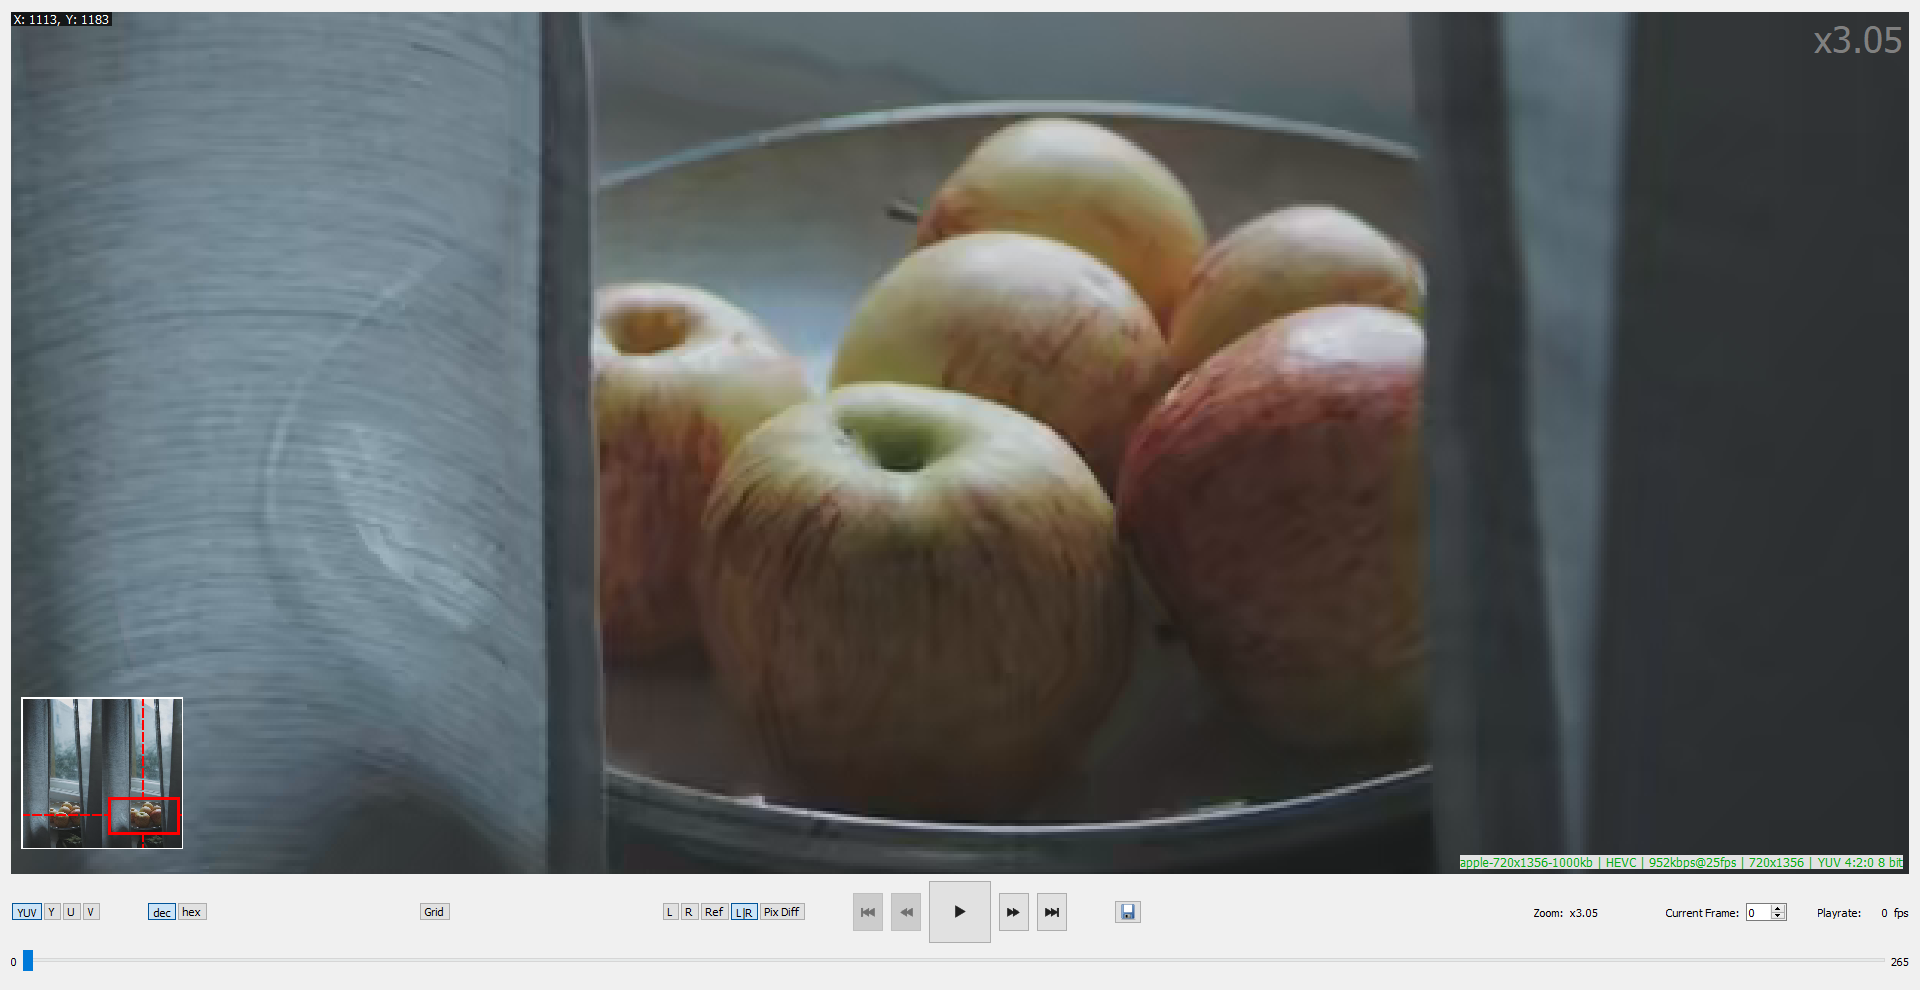
You can navigate by clicking on Image Navigation Panel.
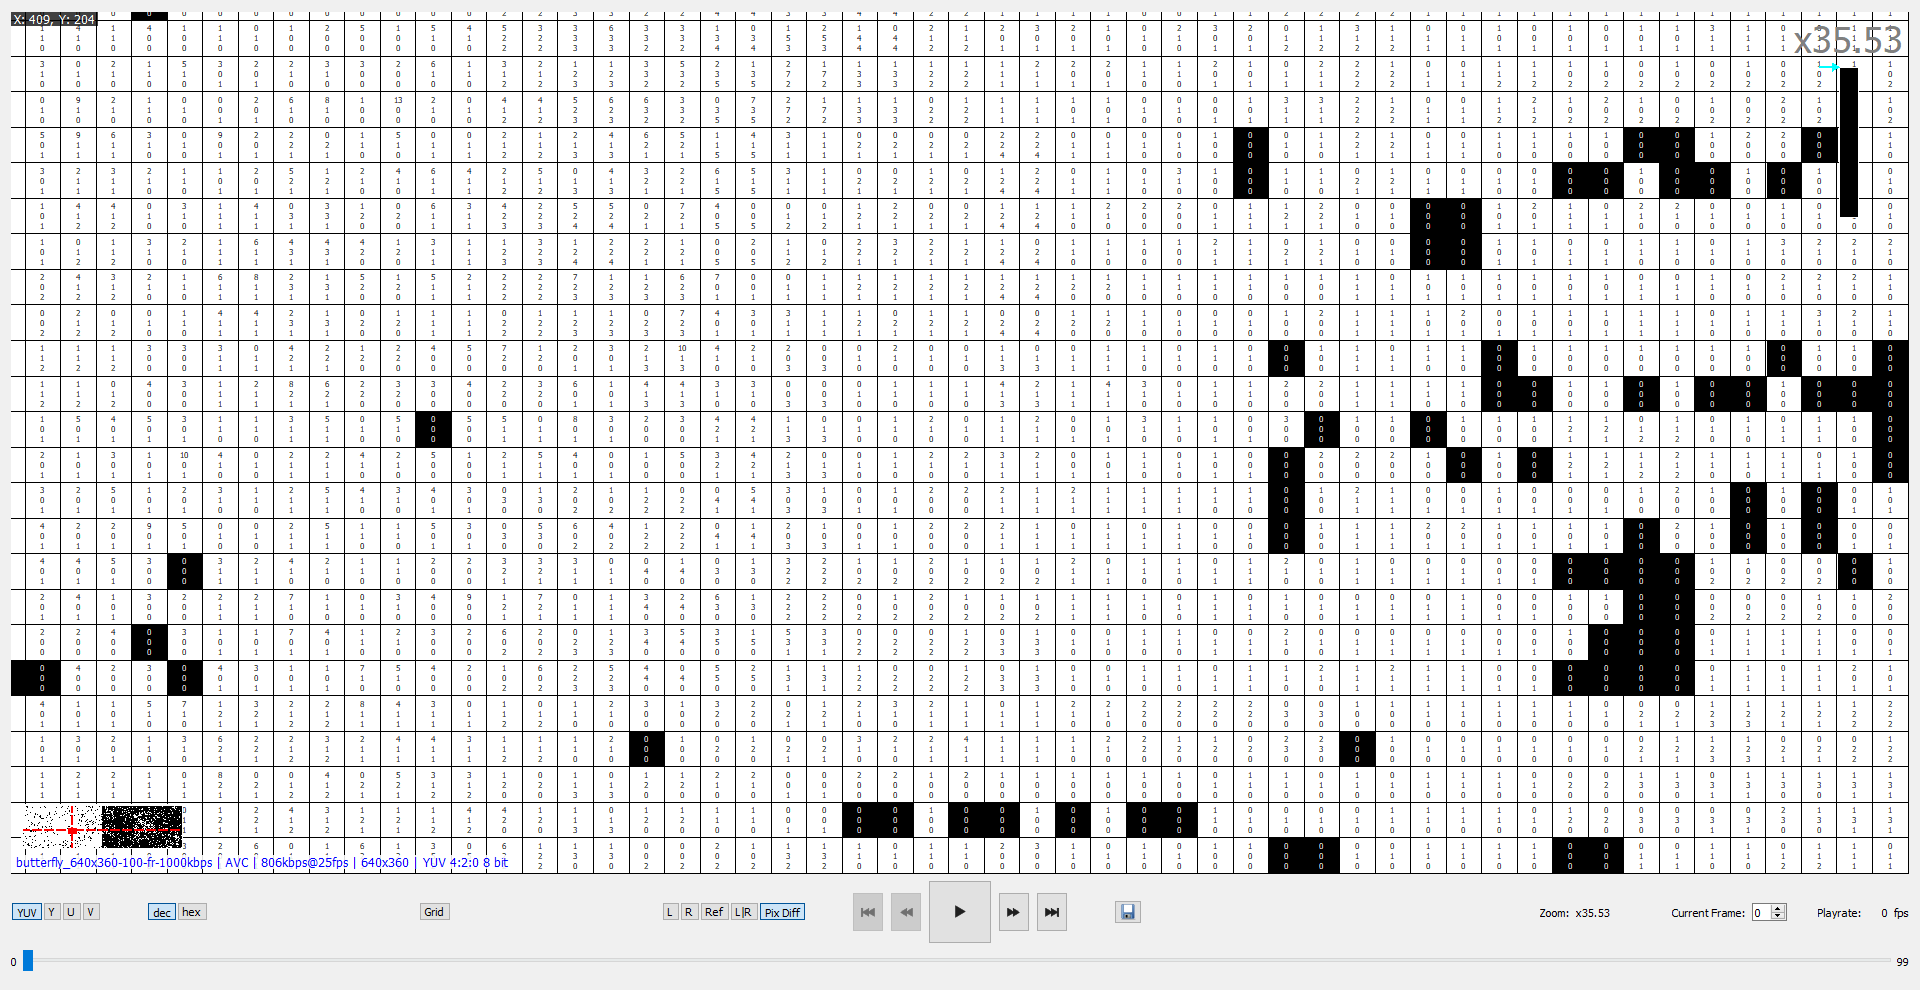
YUV Values
YUV values of the opened files become available starting at a zoom ratio of 32x. These values will look as follows:
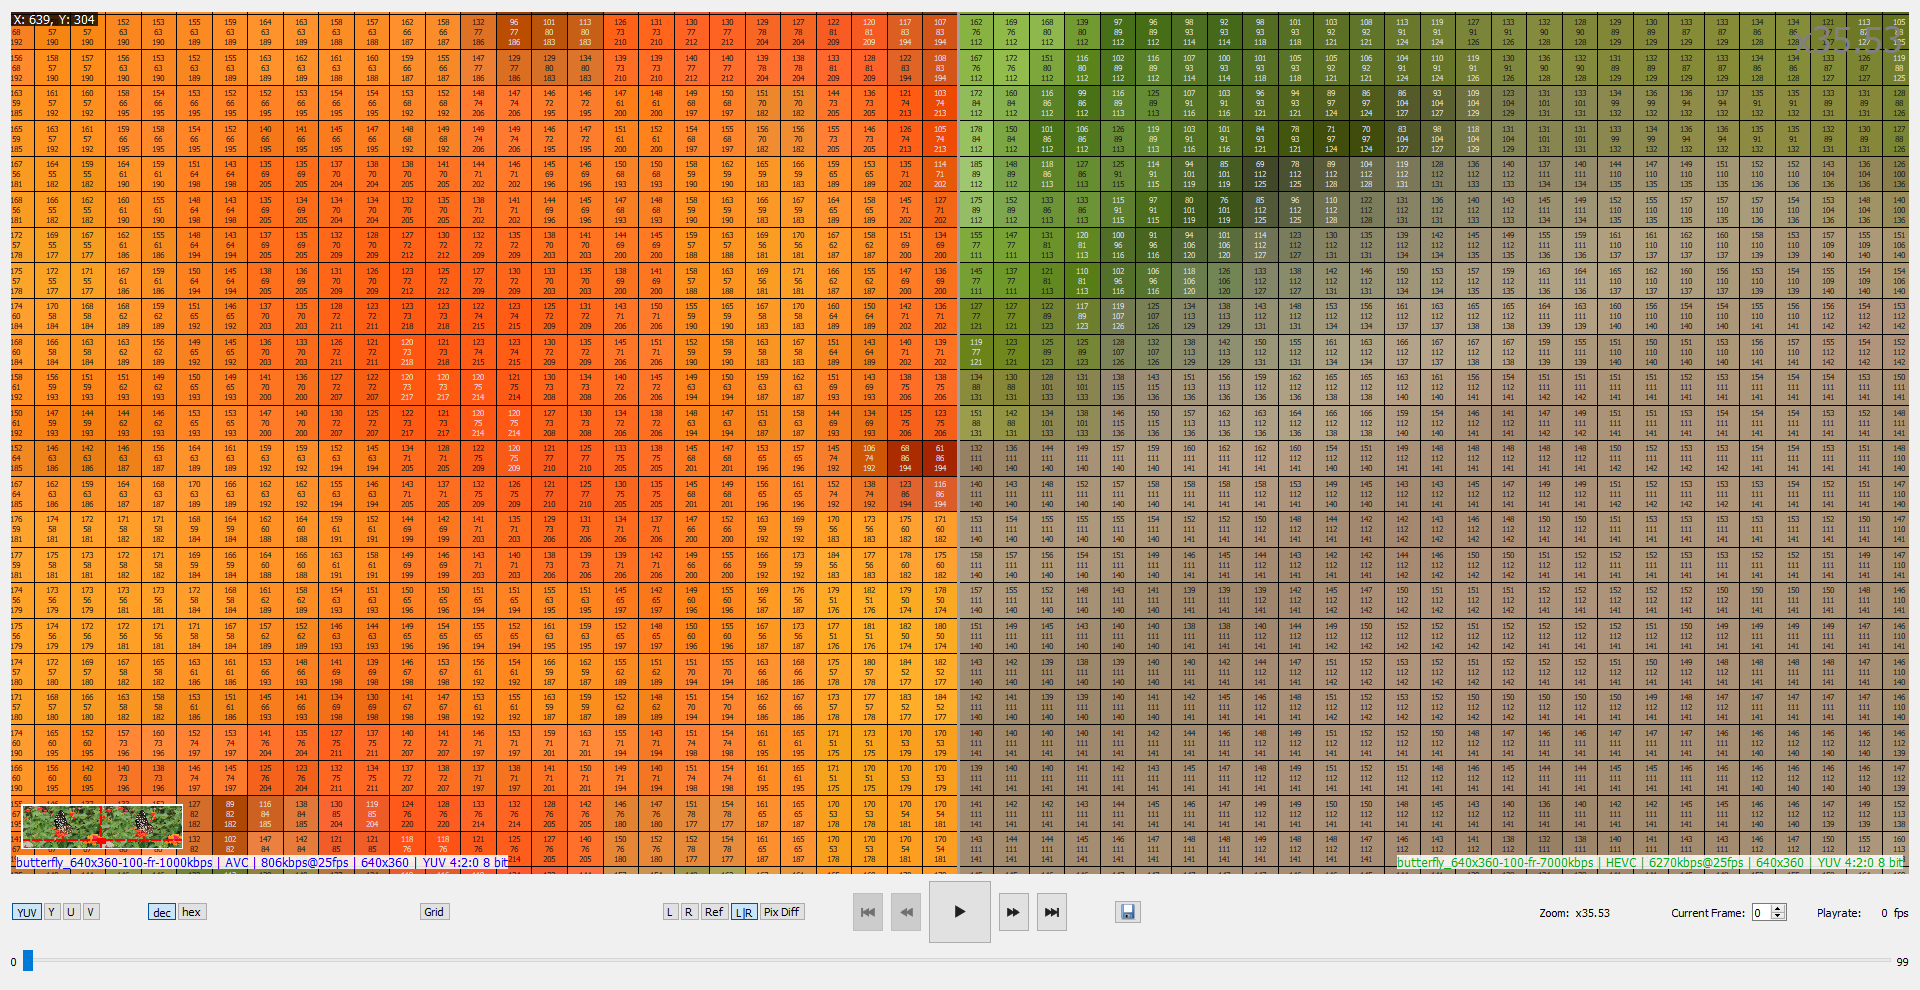
If the currently visible component is chosen for displaying one plane (Y, U, or V), the values for that specific component will be shown. For example:
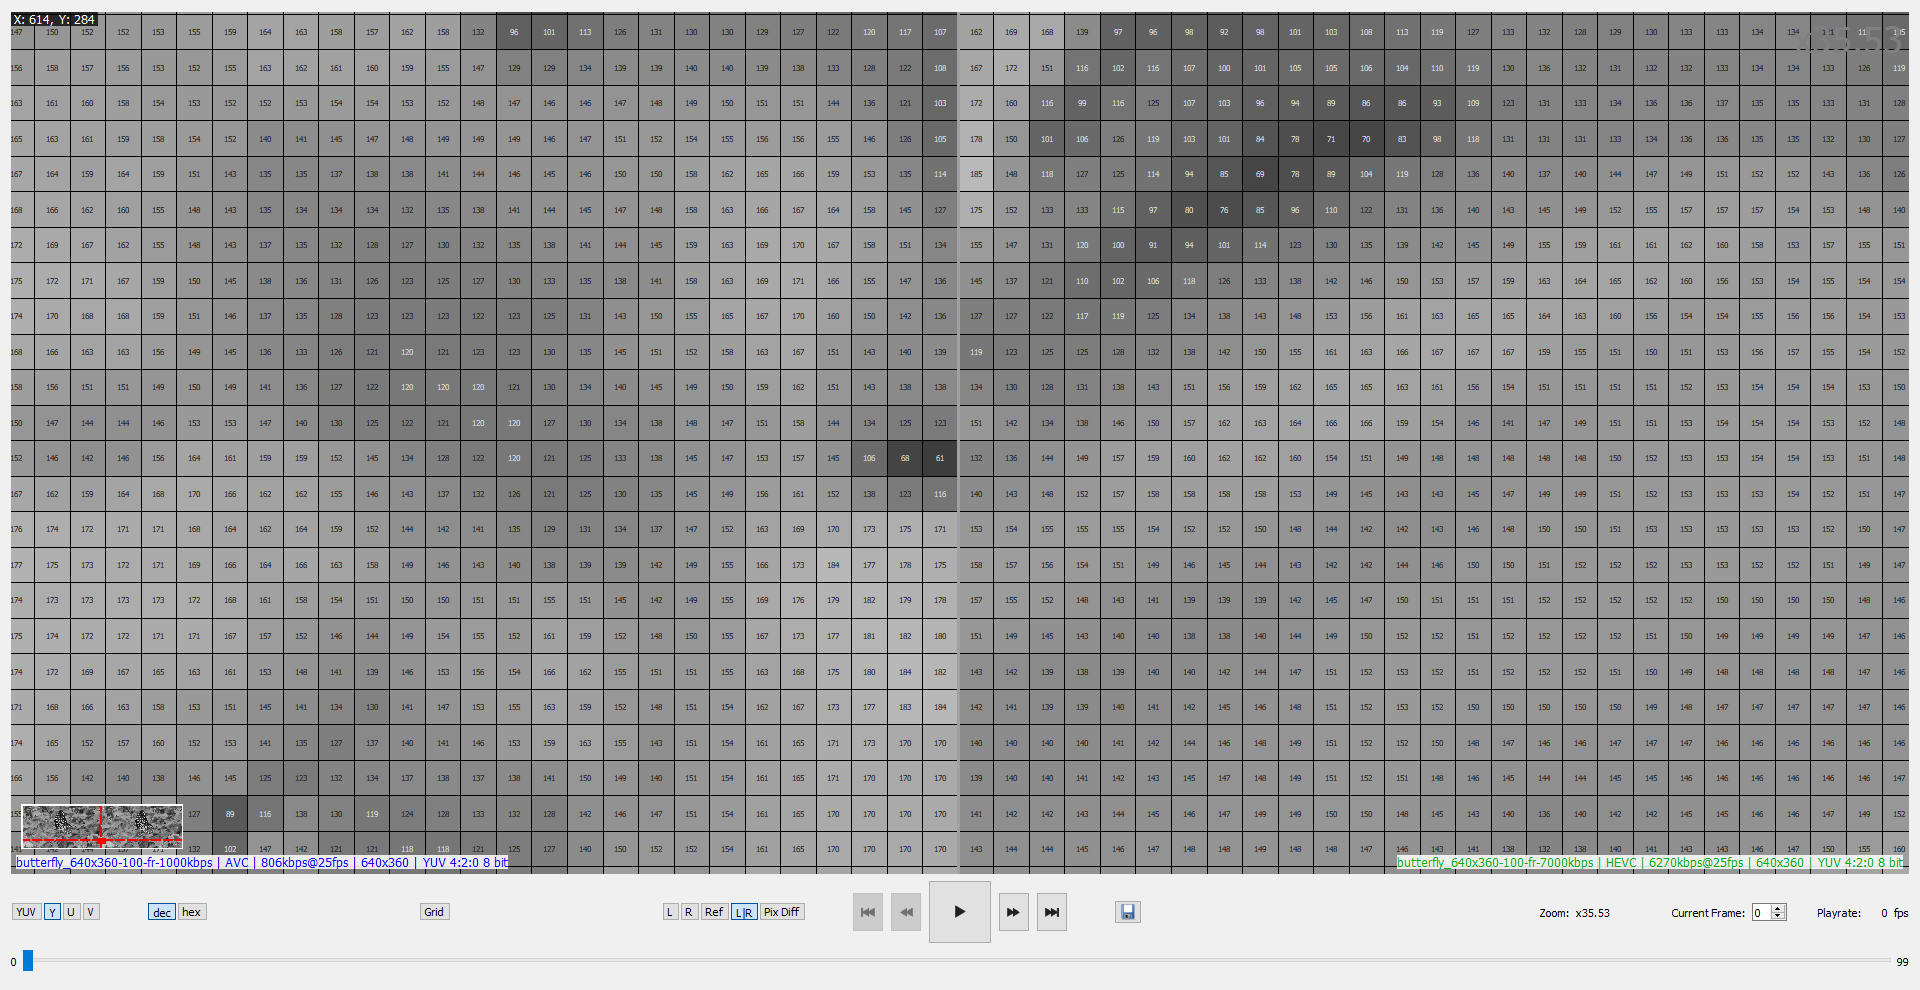
Use the dec/hex switch to show values in decimal or hexadecimal format, respectively.
NOTE: For RGB streams, VQ Probe will display actual RGB values, not YUV.
Heat Map: Difference Between Left(Right) And Reference
This mode allows you to visualize in the form of a heat map the difference between Left's specific frame and the appropriate frame of Reference as well as the difference between Right’s specific frame and the appropriate frame of Reference.
Please choose Pix Diff (or View > Show Pixel Difference from the main menu, or press F5 on your keyboard) to show the heat map. It looks as follows:
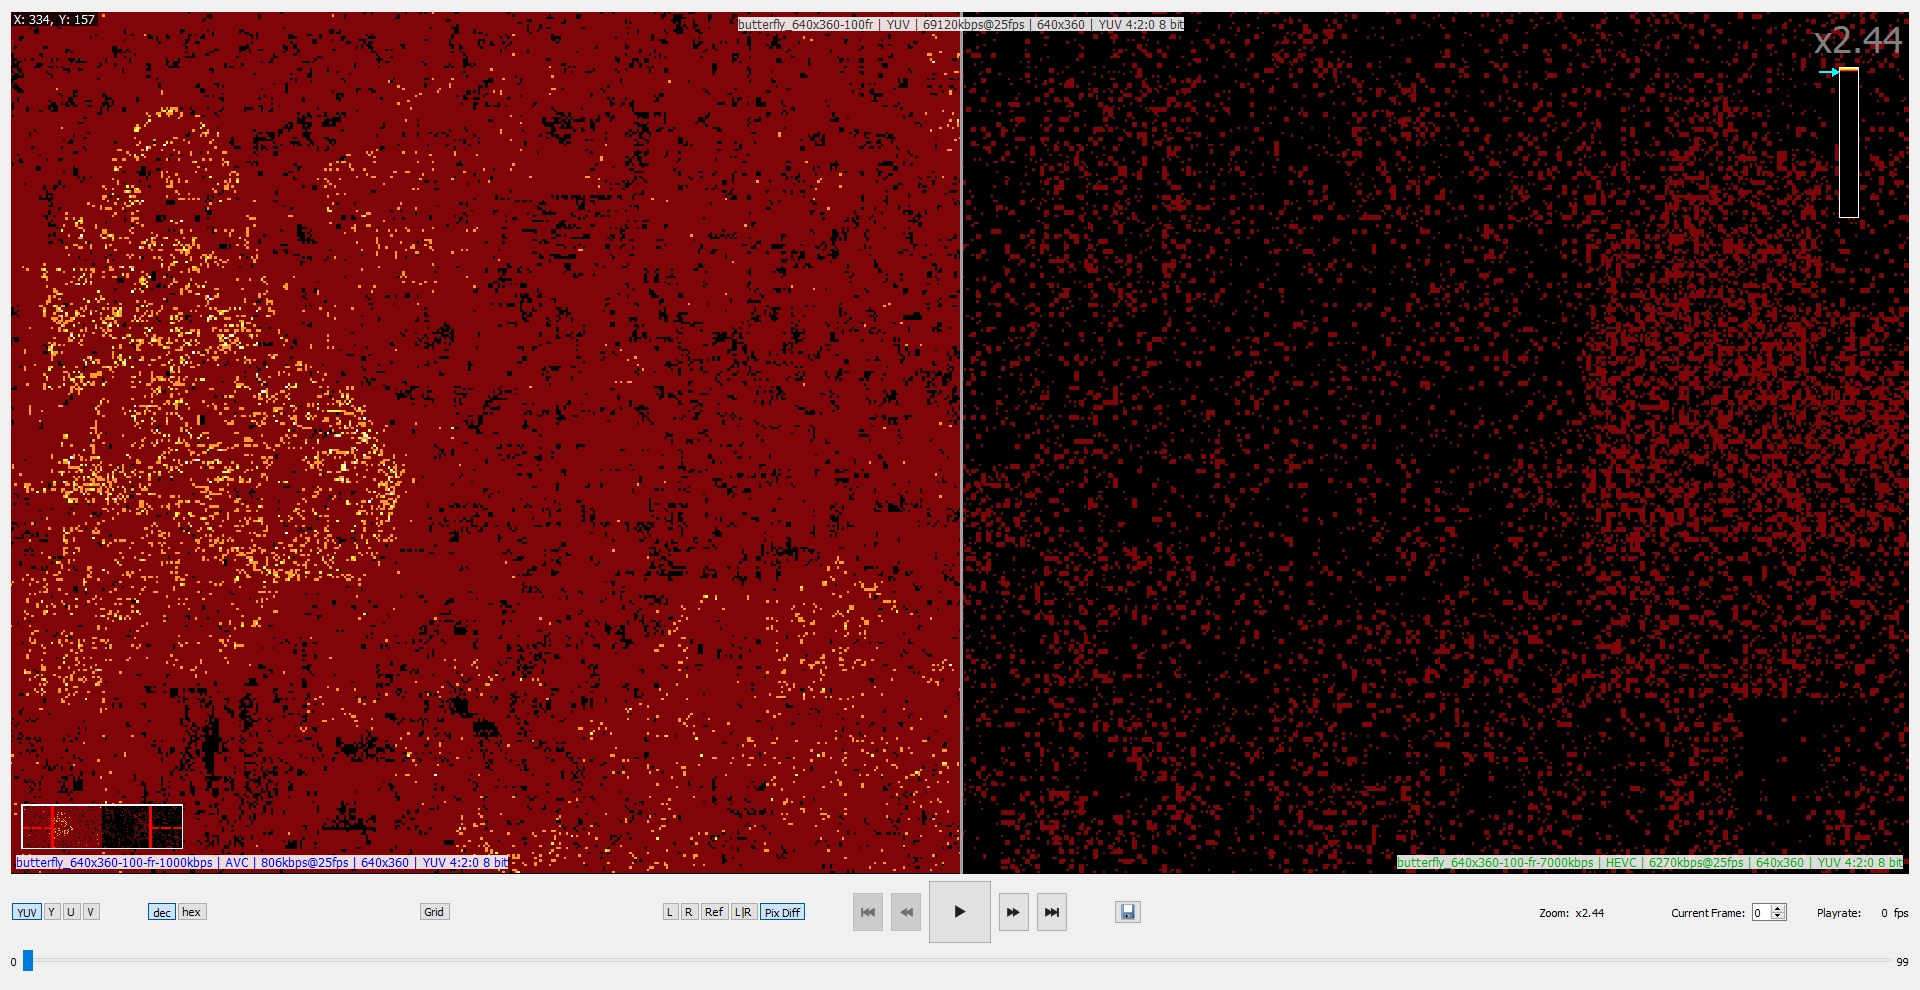
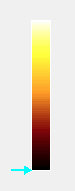
The color represents the difference between a specific pixel of the left (right) frame and a specific pixel of the reference frame, from 0 to the maximum difference:
Black color means there is no difference.
Once zoomed in to a zoom ratio of 32x and above, the values of the difference will be shown:
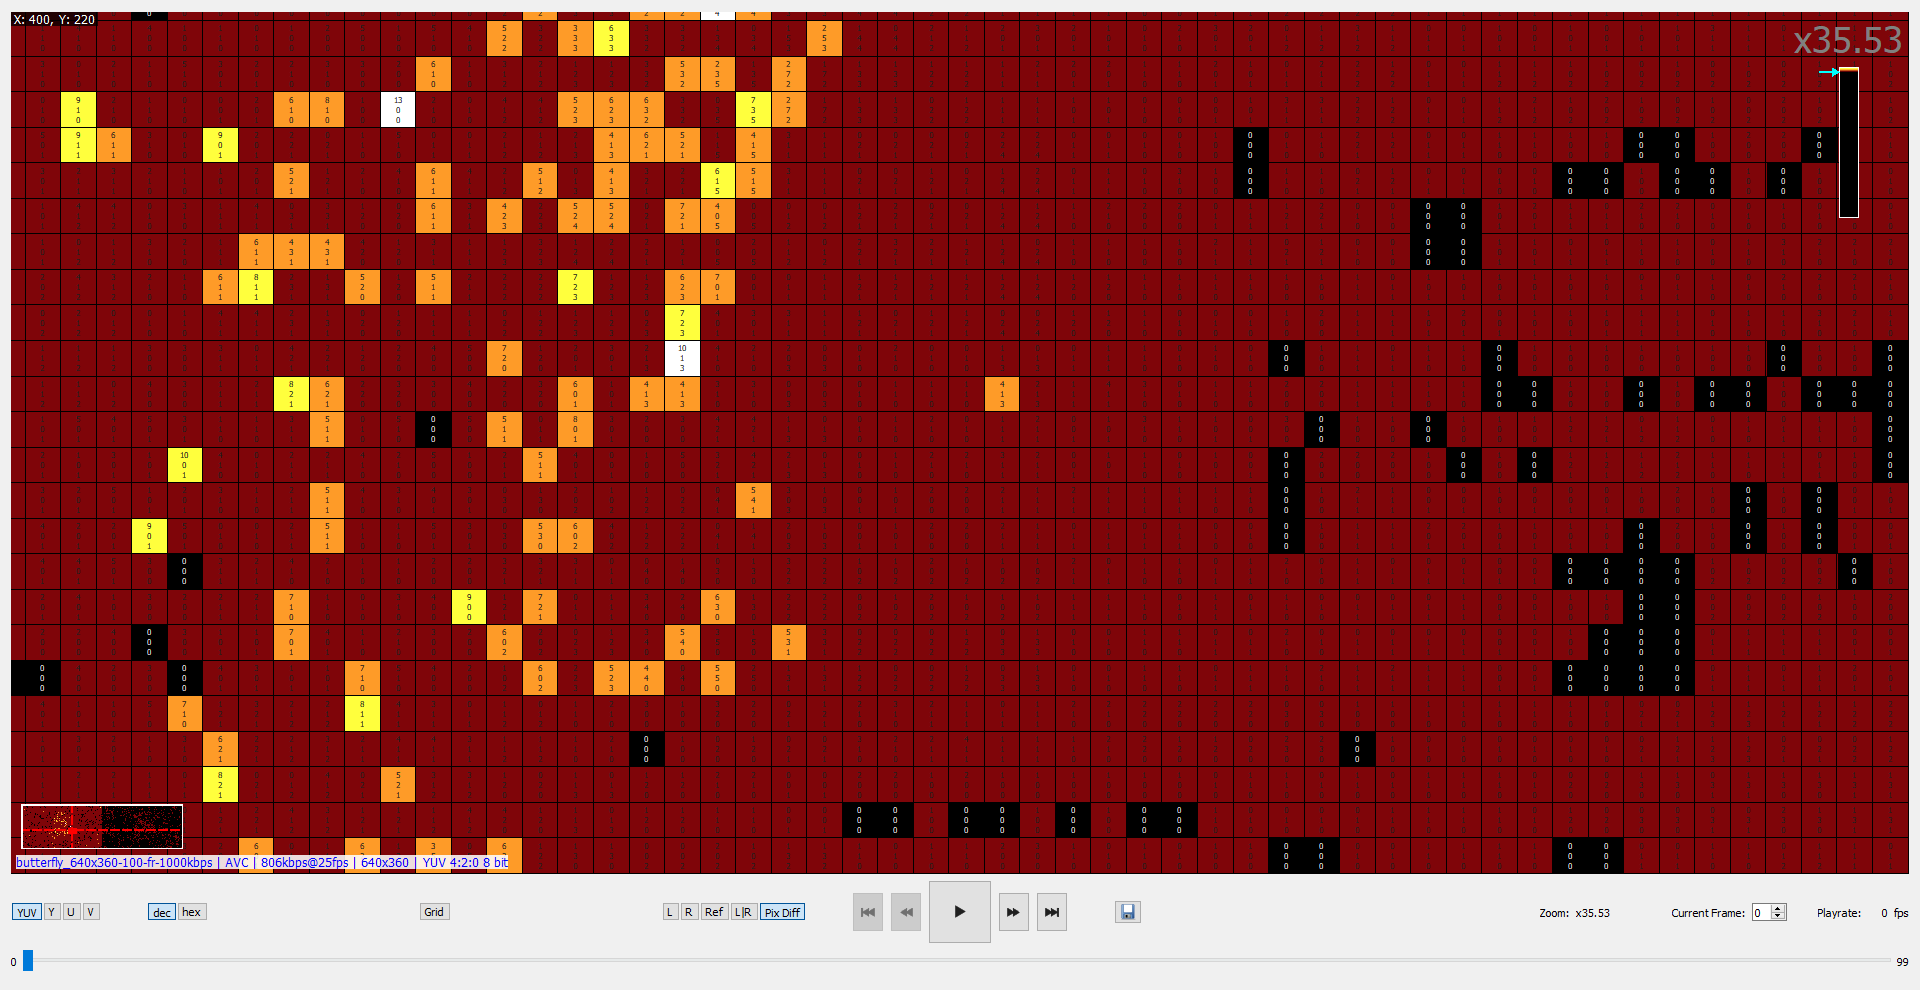
You may also choose a specific plane (Y, U, or V) to show the difference of a specific plane.
If you set the arrow of the heatmap colorbar to the uppermost position, the heat map will become black and white.
NOTE: Heat maps are not available for RGB streams.
Grid Overlay
In this mode, the current frame will be divided into blocks of the selected size.
Please press Grid (or View > Show Grid Overlay from the main menu, or press G on your keyboard) to show the grid overlay.
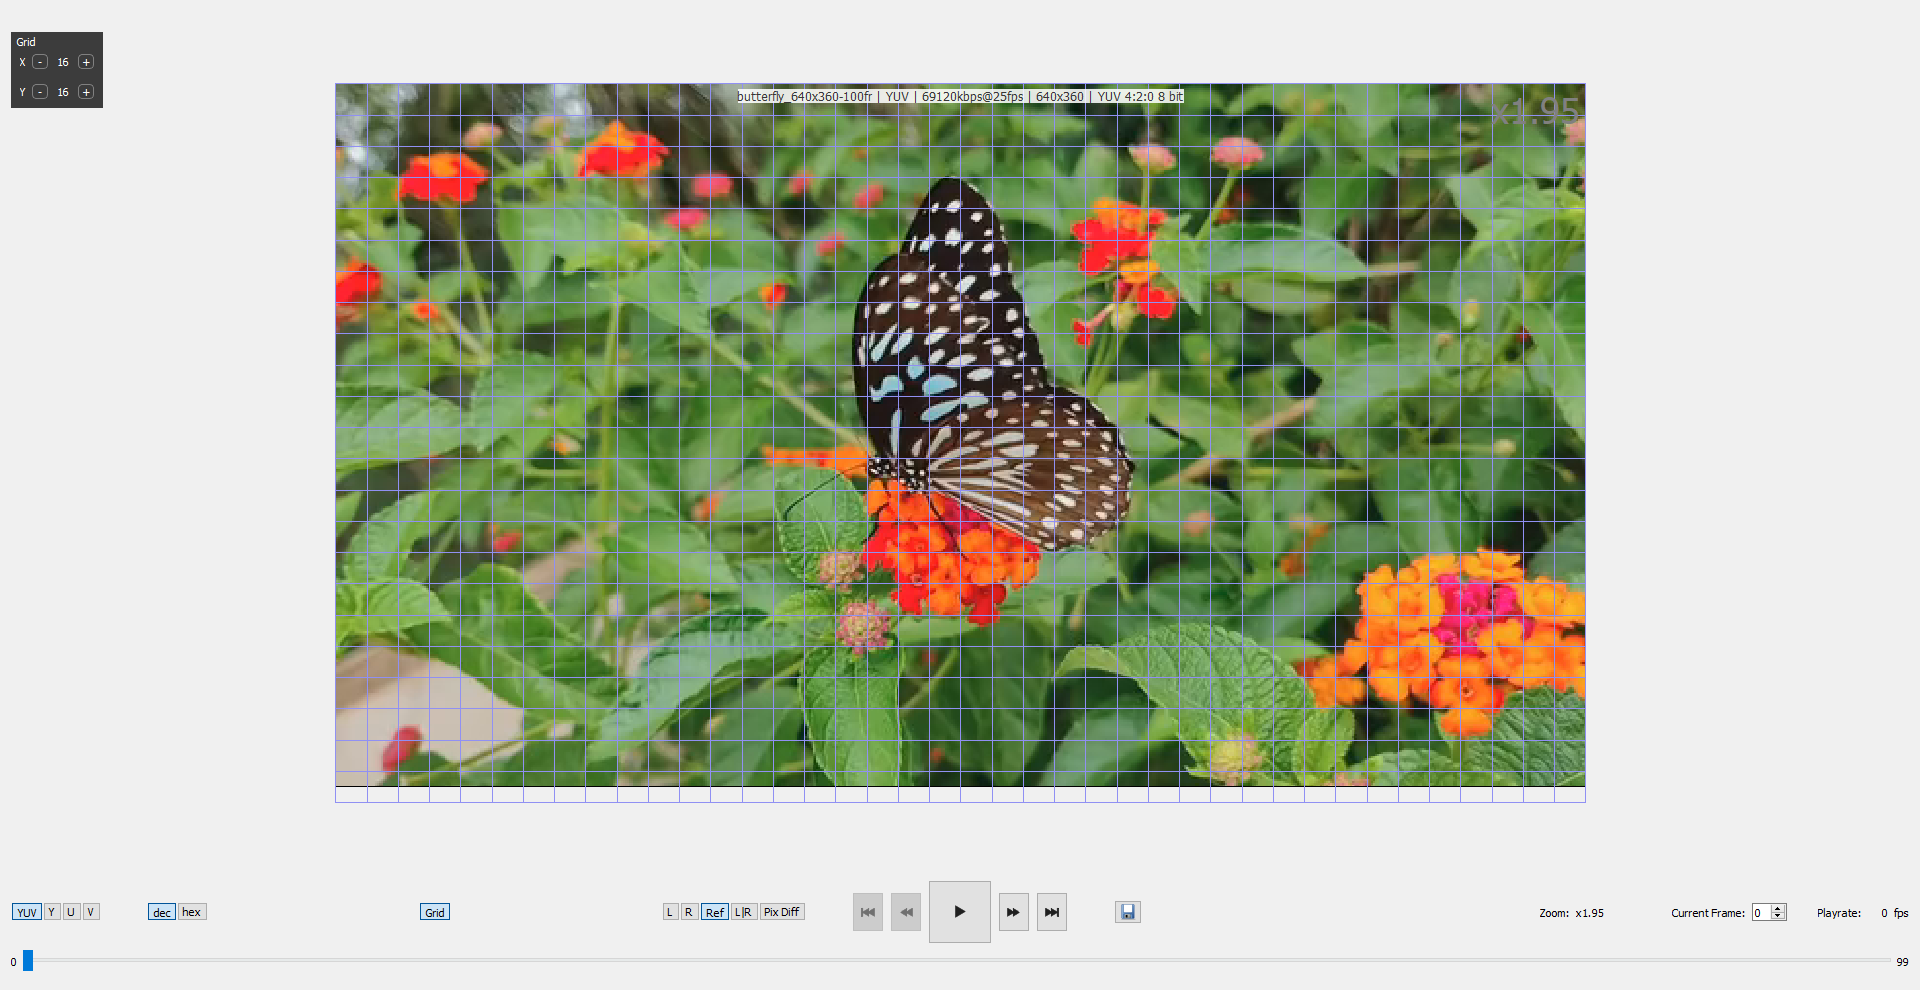
You can set granularity for X and Y using the Grid widget in the upper left corner. You can also move this widget by pressing the left mouse button and moving the mouse.
Hover your mouse over the frame to get a tooltip with information about the block under the cursor.
Save Frame/Video
VQ Probe has the ability to save the current frame or the entire video.
Choose the Playback > Save Frame menu item or press the Save Frame button to save the current frame (a single image file for L, R, Ref; two image files for L|R; three image files for PixDiff).
Choose the Playback > Save Video menu item to save the entire video (including all visible labels, ROIs, found objects, etc.).
Context Menu
Click the right mouse button on Playback View to access a context menu.
This menu duplicates some actions from the View and Playback menus, for which there are no corresponding buttons. You can also quickly set a stream as Left, Right, or Reference.
Video Quality Metrics
VQ Probe allows the user to calculate video quality metrics. The list of quality metrics is provided in this section.
The functionality of video quality metrics calculation is available on Metrics View.
Once at least one target file is opened, and the reference file is opened, VQ Probe is ready to calculate video quality metrics. The user can do that in one of the following ways:
- by clicking Metrics > Run in the main menu
- by clicking Run in Metrics View
- by using hotkeys: Cmd + M (macOS) or Ctrl + M (Windows, Linux)
Metrics calculation starts for every enabled metric. Values appear immediately:
The Run button is disabled if there is no reference file opened.
The Run button is replaced by the Stop button during the metrics calculation process. When the metrics calculation process is in progress, the Pause button appears. By pressing this button you can pause the calculation. When paused, the Resume button appears instead of the Pause button. If you click the Resume button, the calculation will resume. You can also use the corresponding actions in the Metrics menu or the Ctrl + Space hotkey.
The currently visible metric can be changed via the Metric combo-box.
For every graph a legend is available. You can move it by pressing the left mouse button and moving the mouse. Click the right mouse button to restore the default position of the legend. You can also click one of the legend items to show or hide the corresponding curve.
VQ Probe allows the user to customize graphs. Go to Tools > Options > Common Metrics > GUI to find customization options; see the Options section for more information.
Click the Export Plot button in the bottom-left corner of any plot to export it.
Navigation
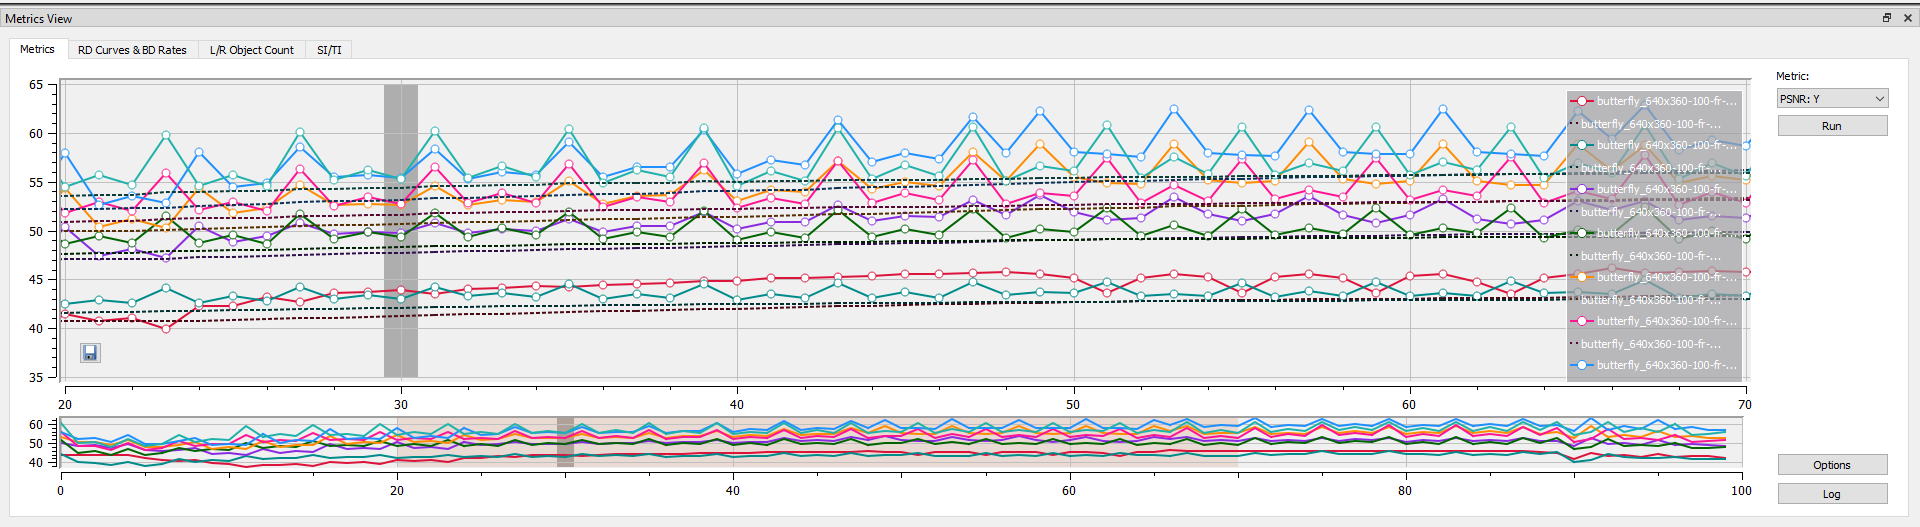
The user can see exact numbers for a specific frame by moving the cursor over a graph. A tooltip will show the frame number and metrics values for that frame.
Hover your mouse over one of the axes and scroll the mouse wheel to change the scale. Press Ctrl+LMB and drag your mouse over a graph to zoom in to a particular area of the graph.
You can navigate by clicking on a specific frame in Metrics View. After that, the actual image(s) in Playback View will be changed according to the selected frame.
Similarly, once the current frame is changed in Playback View, the current frame selection in Metrics View will be changed.
If you expand Metrics View vertically you will see a small preview plot. It can be used for navigation as well.
Regions Of Interest
The user can set regions of interest (or ROIs). Metrics will be calculated only for these regions. To set ROIs, go to the ROI tab of Project View.
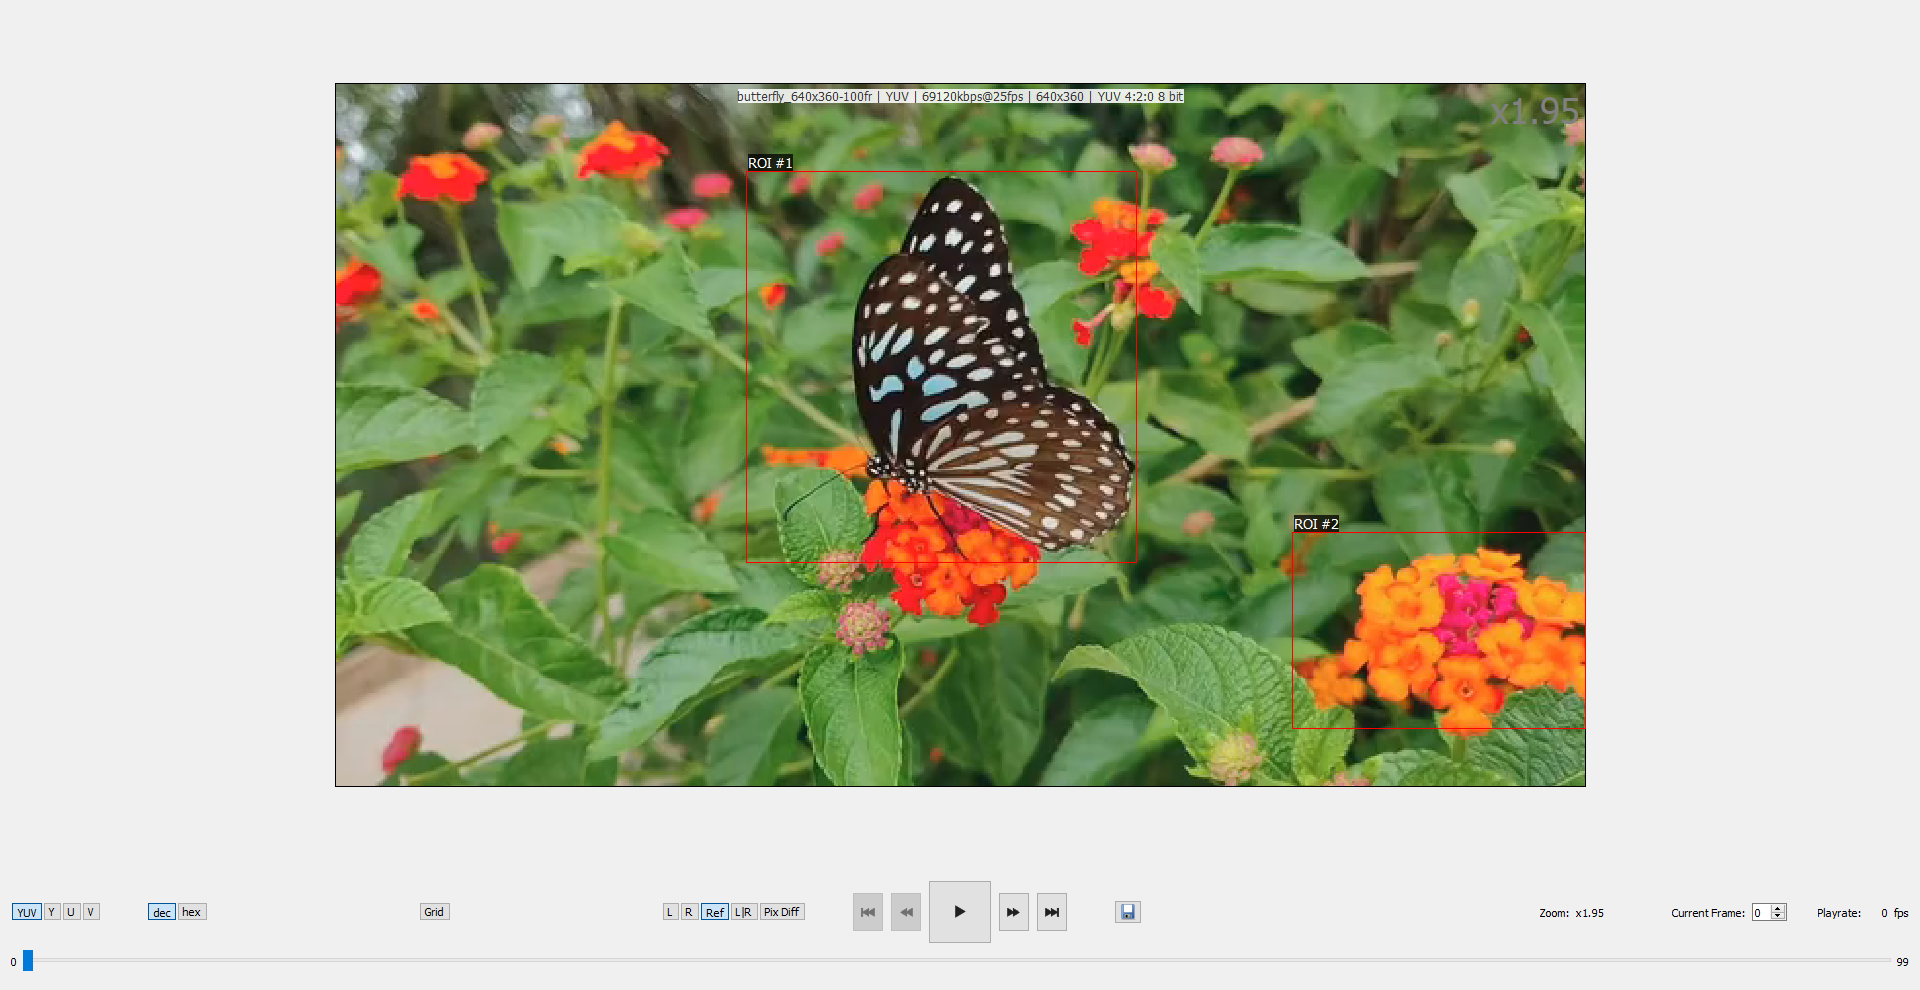
Check the View > Show ROI Bounding Boxes menu item to make the current ROIs appear on Playback View.
Metrics Log
VQ Probe has the ability to present results of metrics calculation not only in the form of graphs, but also using the Metrics Log window. Click the Log button to open it.
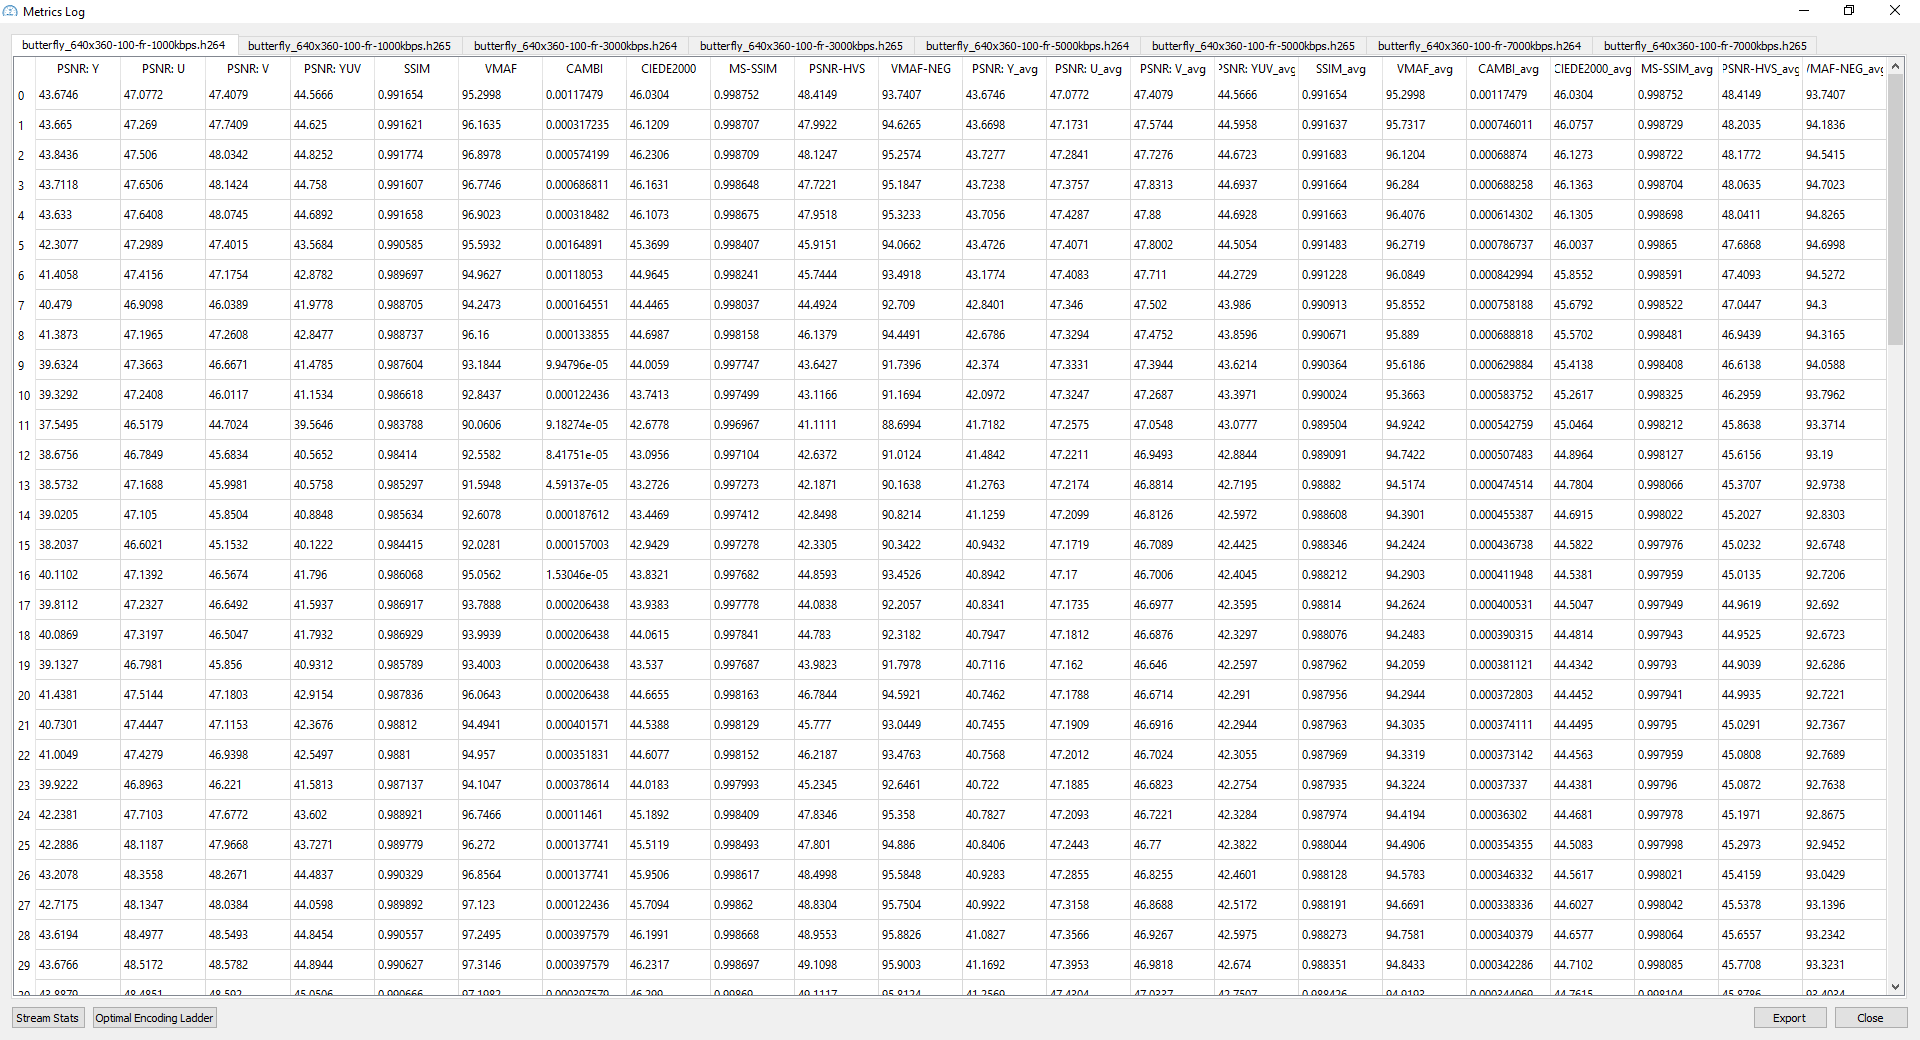
The Metrics Log consists of tables for every non-reference file of the project. Every table contains metrics values for every frame of a stream. Click the Export button to export the current table. You can export a table in JSON or CSV.
You can also inspect several statistics for every stream. Click the Stream Stats button to open the Stream Stats Log.
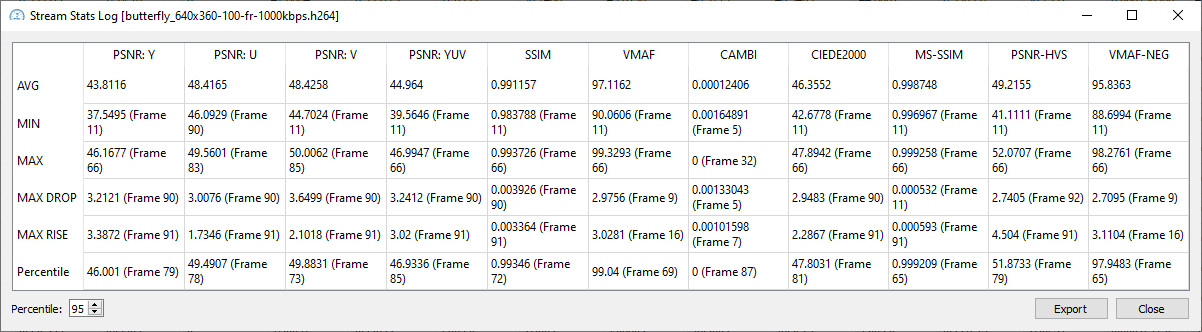
Use the Percentile spinbox to set a desired percentile value. Values in the Percentile row will be updated immediately. Please note that VQ Probe uses the nearest-rank method to compute percentiles.
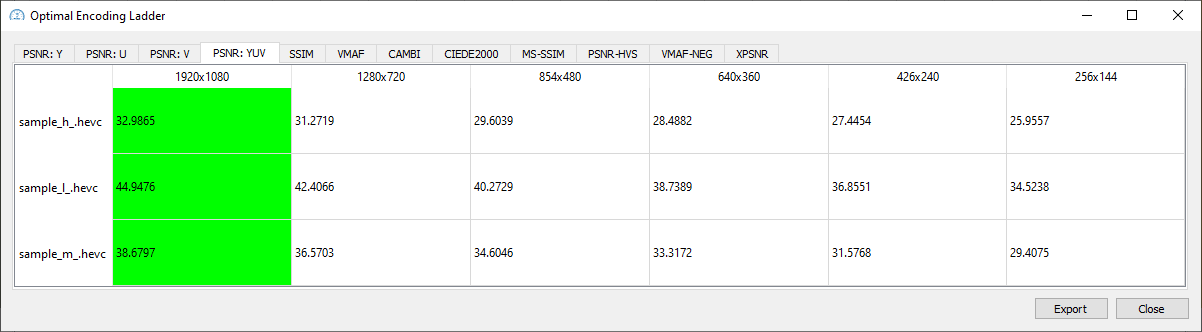
VQ Probe is able to build optimal encoding ladders. Click the Optimal Encoding Ladder button to build a ladder for different bitrates and resolutions.
Caching Data
Once you check the Autosave Results checkbox (found here: Tools > Options > Common Metrics; see the Options section), results of metrics calculation will be saved in a folder near the project file after the calculation process is finished.
If you also check the Use Cached Results checkbox, the next time you press the Run button, graphs will be built on the fly using the cached data.
If there are no cached results for some files, VQ Probe will calculate metrics for those files. For other files, VQ Probe will use the cached data.
If the current active metrics do not match the active metrics from the cache, VQ Probe will calculate metrics that are missing from the cache. For other metrics, VQ Probe will use the cached data.
If there are cached results for files that are no longer present in the project file, VQ Probe will load these results as well. However, these results will only contain metrics present in the cache; VQ Probe will not be able to calculate other metrics for such files.
NOTE: If your project has some unsaved changes and the Autosave Results checkbox is checked, these changes will be saved anyway the next time results are saved.
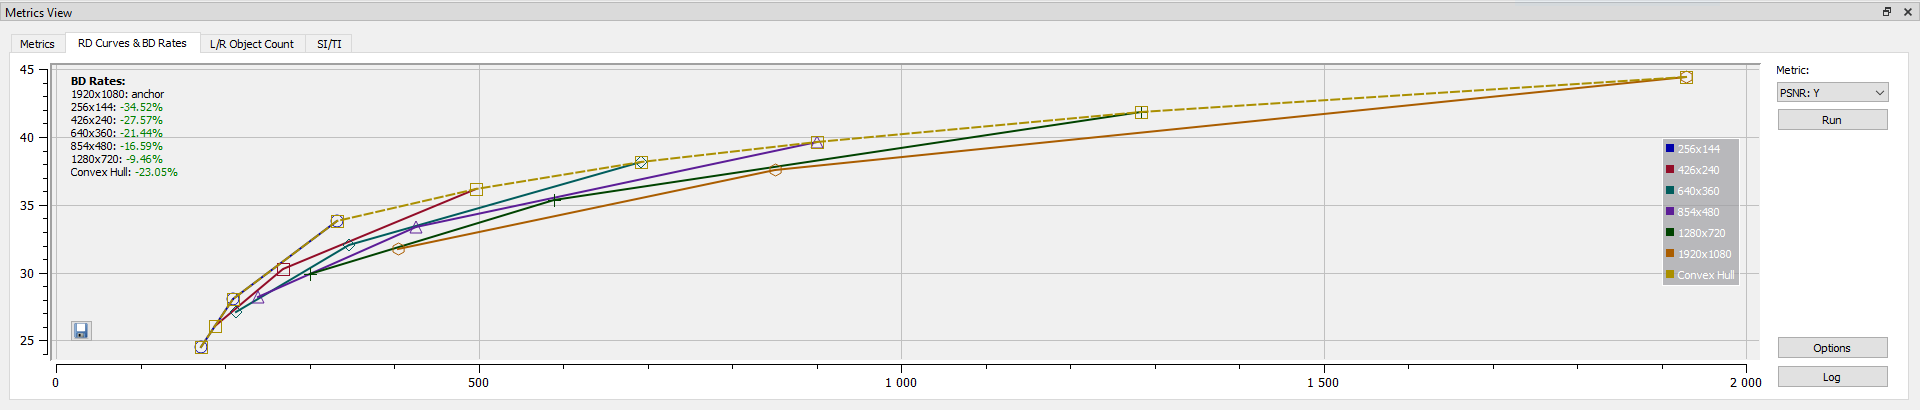
RD Curves
The RD Curves & BD Rates tab allows you to plot RD Curves as well as calculate BD Rates. Please make sure you set up the RD Curves list (please refer to the Create RD Curves section).
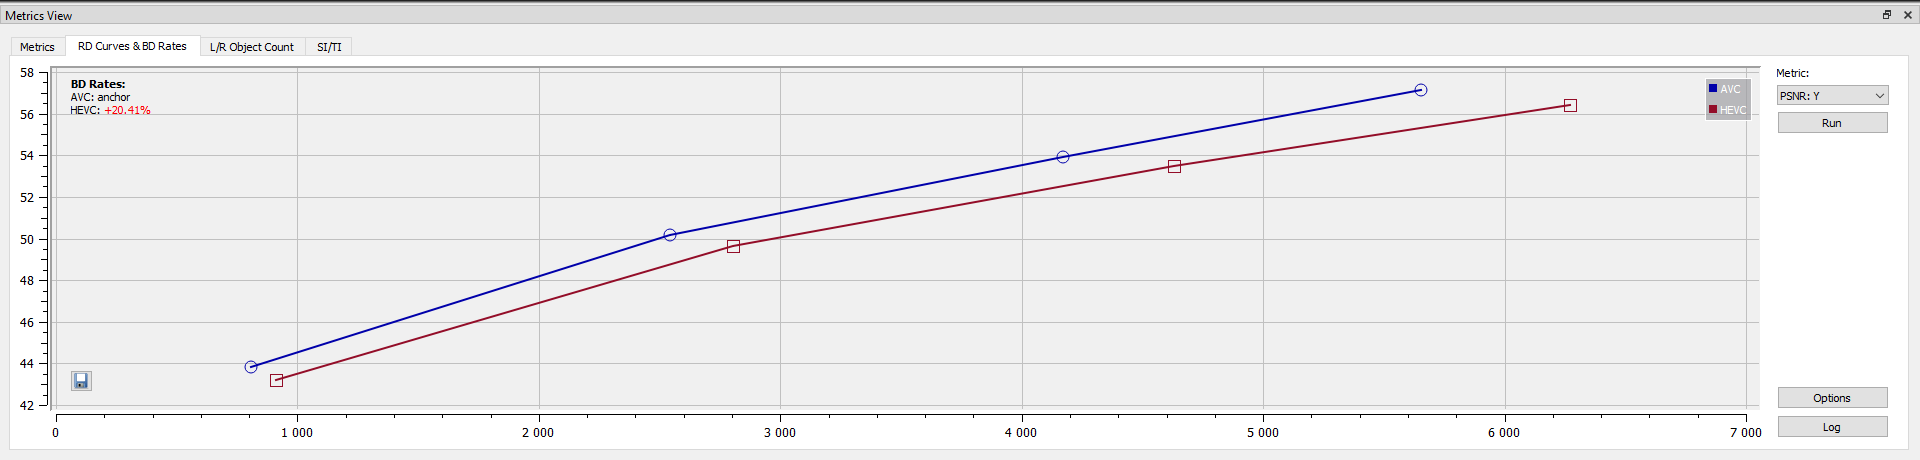
The tab contains the following information:
- BD Rates: a list of BD Rates. BD Rates are calculated for every non-anchor RD Curve in relation to the anchor RD Curve.
- RD Curves Graph: a graph that consists of points, each of them is an average appropriate metric value at a specific file’s average bitrate.
Changing the Metric combo-box will change the current RD Curves graph to a graph for the selected metric.
Please note that BD Rate calculation is undefined in several cases:
- RD Curves contain only one file.
- At least one Y-value of an RD Curve is less than 0 or greater than 99.
- RD Curves are not monotonically non-decreasing.
NOTE: For the case of two-file RD Curves, the accuracy of BD Rate calculation will be rather low.
Convex Hull For RD Curves
In this mode, a convex hull will be built for the given set of RD Curves. To enable this mode, check the Enable Convex Hull checkbox in Project View > RD Curves.
When the mode is enabled, you can add streams of different resolutions. It can be useful to set up a couple of RD Curves (each curve consisting of streams with the same resolution), then run the calculation. The resulting convex hull can be used to compare different resolutions of the reference file.
You can choose a scaling algorithm here: Tools > Options > General (see the Options section). The default algorithm is Lanczos with param[0] = 5; Bicubic have both params set to zero.
NOTE: VQ Probe also provides a convex hull sample project. Go to File > Samples to find it.
Object Detection
Another feature of VQ Probe is the ability to detect objects using machine learning. Results are presented on the L/R Object Count tab.
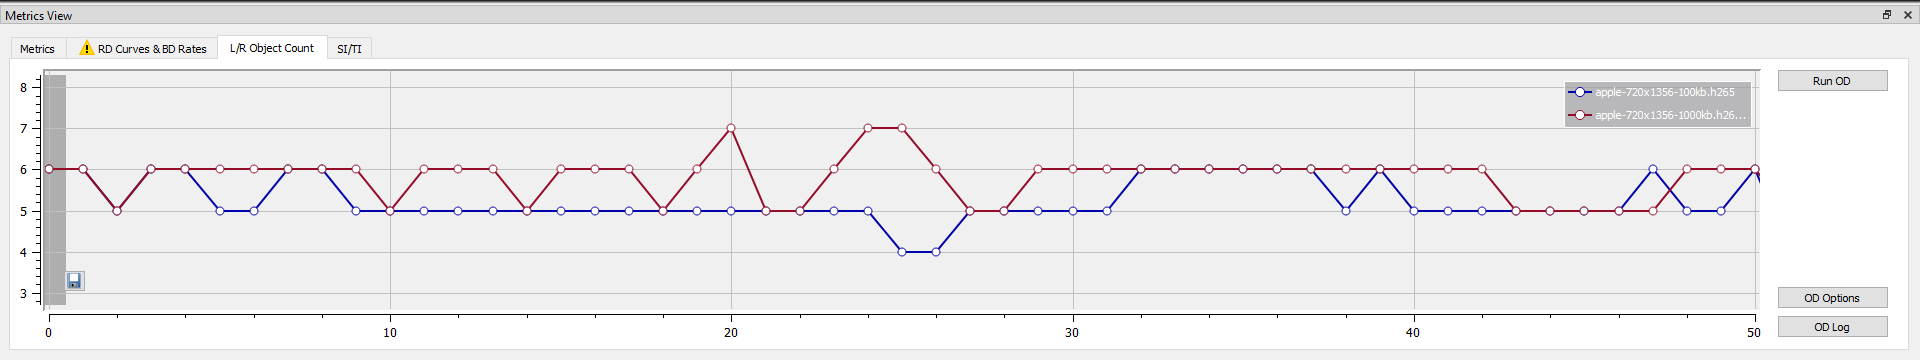
Click the Run OD button to start the detection. The first time you run the detection, you will be asked to download model files. When the files are downloaded, the detection will start.
NOTE: on macOS, you need to run VQ Probe as root to be able to download the model files. This is only needed once.You can also pause the detection (and then resume it). If you click the Stop OD button, the detection will be stopped.
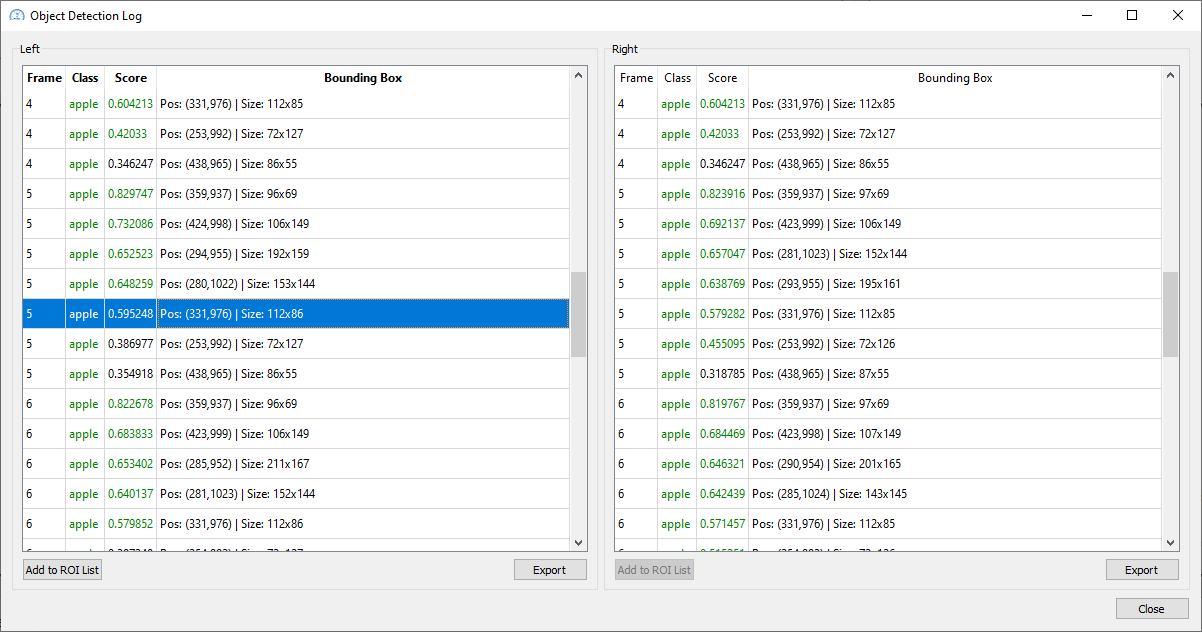
Use the OD Log button to see the output of the object detection model (i.e. found objects, scores, etc.). The objects presented on the graph have their class and score highlighted in green (see the Options section).
You can also add a found object to the current project as a region of interest (ROI). Click the Add to ROI List button to add the selected object.
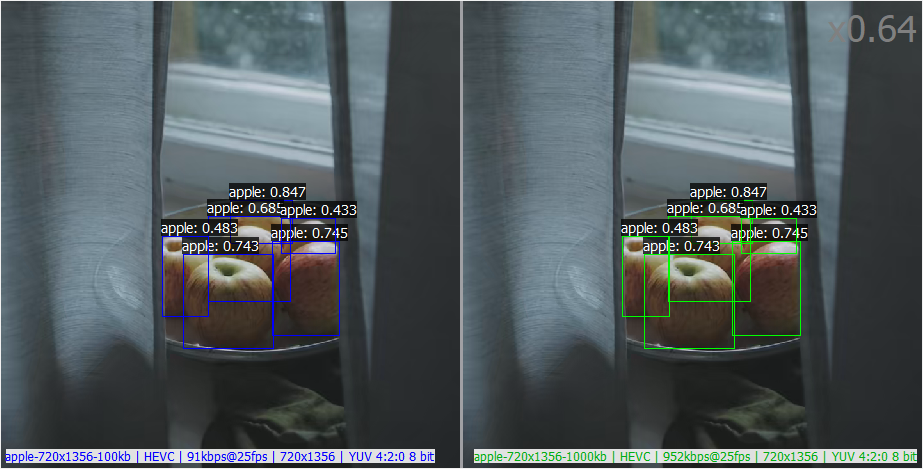
Check the View > Show Object Bounding Boxes menu item to make the objects presented on the graph appear on Playback View.
SI / TI
This tab allows you to calculate SI (or spatial perceptual information) and TI (or temporal perceptual information) according to ITU-T P.910 (11/21) for every opened 8-bit stream.
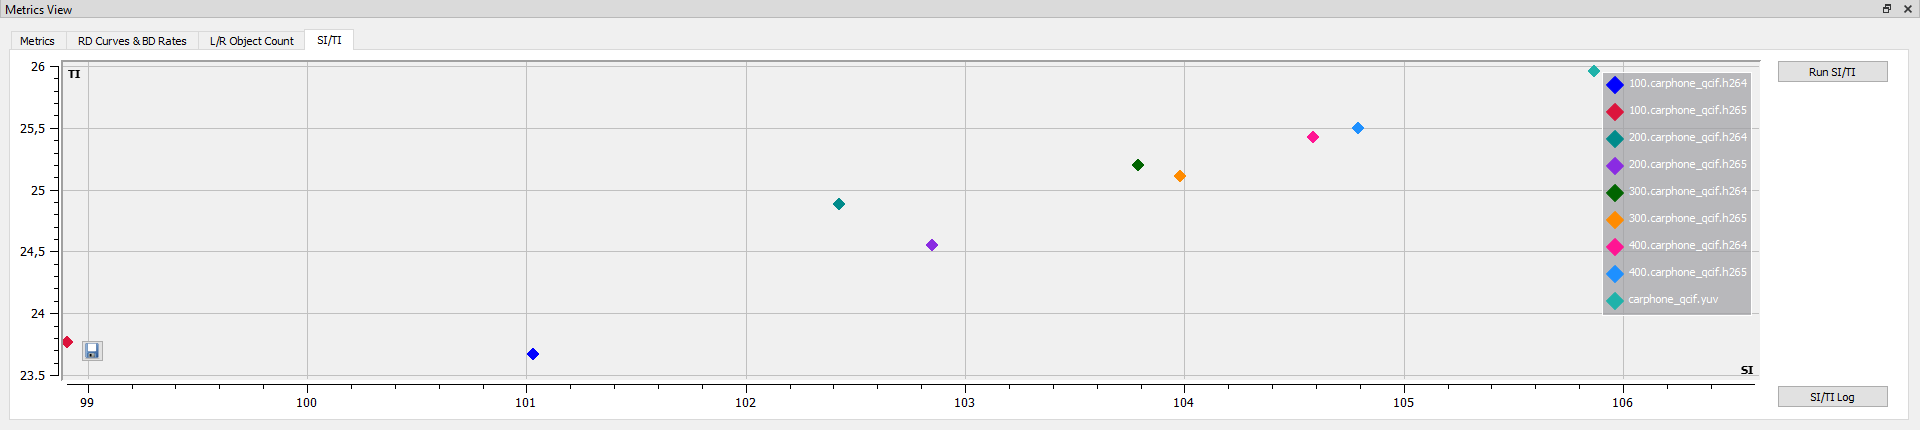
SI is a measure that generally indicates the amount of spatial detail of a picture. It is usually higher for more spatially complex scenes.
TI is a measure that generally indicates the amount of temporal changes of a video sequence. It is usually higher for high motion sequences.
Click the Run SI/TI button to start the calculation. If you click the Stop SI/TI button, the calculation will be stopped. You can also pause and resume it whenever you want.
Use the SI/TI Log button to view per-frame SI/TI values for every stream (maximum values are highlighted in dark green).
NOTE: if a maximum SI (or TI) value exceeds 255, the value on the graph will be changed to 255. However, the SI/TI Log will still contain actual per-frame values.
Scene Change Detection
VQ Probe is capable of finding scene changes in a stream that is set either as Left, Right, or Reference (see the Options section). For scene change detection, we use an FFmpeg-based algorithm with some improvements.
To start scene change detection, click the Tools > Start Scene Change Detection menu item or use the Ctrl + E hotkey. To stop scene change detection, click the Tools > Stop Scene Change Detection menu item or use the Ctrl + E hotkey again.
If you check the Autosave Scene Changes checkbox (found here: Tools > Options > Scene Change Detection), scene changes will be saved in the project file after the detection process is finished.
If you also check the Use Cached Scene Changes checkbox, VQ Probe will use this cached data.
NOTE: If your project has some unsaved changes and the Autosave Scene Changes checkbox is checked, these changes will be saved anyway the next time scene changes are saved.Press the right mouse button on a scene on the slider to open a context menu.

Press Set Start/End to this scene to trim streams to a chosen scene. Press Reset Start/End to default to reset Start/End frame numbers for all streams.
Options
Open the Tools menu. Here you can find:
- Open VQ Analyzer: open VQ Analyzer (go to Tools > Options > General to set the VQ Analyzer path)
- Color Standard: change the current color standard (ITU 601, ITU 709, BT.2020)
- Color Range: change the current color range (Limited or Full)
- Start Scene Change Detection: see the Scene Change Detection section
- Stop Scene Change Detection: see the Scene Change Detection section
- Options: see below
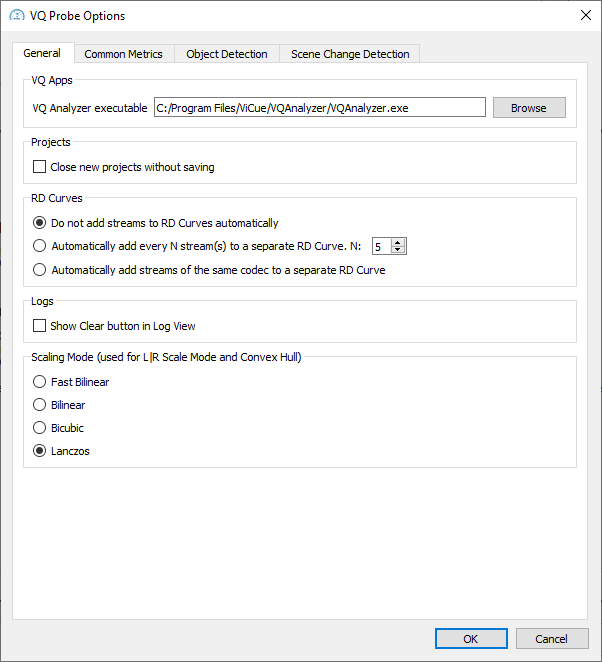
Go to Tools > Options or use the Ctrl + Shift + O hotkey to open the VQ Probe Options dialog.
There are 4 tabs:
- General:
- VQ Apps:
- VQ Analyzer executable/bundle: set the VQ Analyzer executable (bundle on macOS) path
- Projects:
- Close new projects without saving: close new (i.e. default) projects without a message box
- RD Curves:
- Do not add streams to RD Curves automatically: streams are not added automatically to RD Curves
- Automatically add every N stream(s) to a separate RD Curve: set the number N so that every N streams are added to a separate RD Curve
- Automatically add streams of the same codec to a separate RD Curve: every codec will have its own RD Curve
- Logs:
- Show Clear button in Log View: show a button to clear contents of Log View
- Scaling Mode: select one of four scaling algorithms (used for L|R Scale Mode and Convex Hull)
- VQ Apps:
- Common Metrics:
- Active Metrics: manage active metrics (by default, only PSNR is enabled)
- Weights for PSNR: YUV: set custom weights for PSNR: YUV
- Calculation Mode: set the calculation mode (press ↻ to check your PC configuration and update the available calculation modes)
- GUI:
- Show Cumulative Average Curves: show Cumulative Average curves
- Show Dots on Curves: show dots on curves
- Cache:
- Autosave Results: autosave results of video quality metrics calculation
- Use Cached Results: use the results stored in the project file to build graphs on the fly
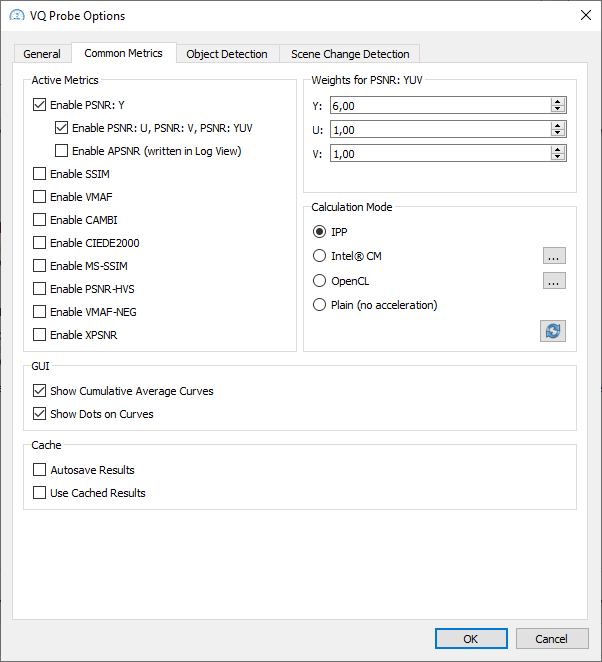
Please note that the Common Metrics tab is not accessible during the metrics calculation process. Click the Stop button or wait for the process to finish to access the tab.
- Object Detection:
- Score Threshold: set the score threshold (i.e. objects with a score below this threshold will not be presented on the L/R Object Count graph). The default value is 0.75.
- Choose the active classes: only objects with a class that is set as active will be presented
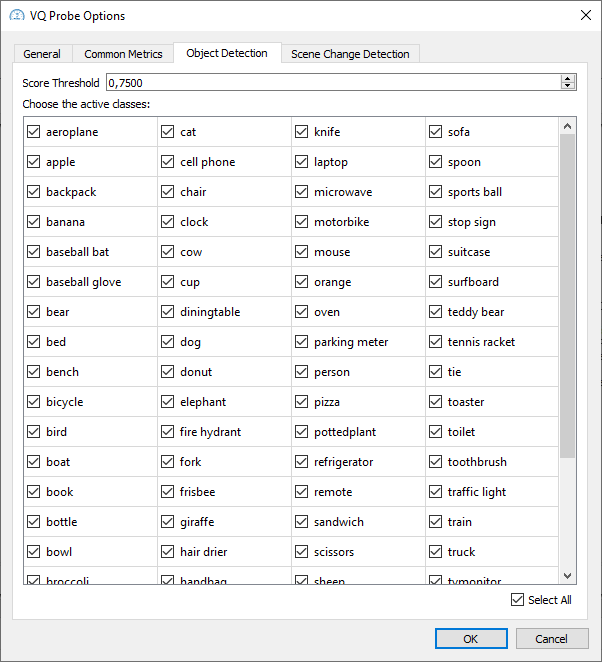
Please note that the Object Detection tab is not accessible during the detection. Click the Stop button or wait for the detection to finish to access the tab.
- Scene Change Detection:
- Autosave Scene Changes: autosave scene changes
- Use Cached Scene Changes: use the scene changes stored in the project file to show on the slider
- Show Scene Changes for: select the file (L, R, or Ref) for which scene changes will be detected
- Threshold: set the threshold (the default value is 0.2)
- Scene Change Colors: choose the colors that indicate scenes on the slider
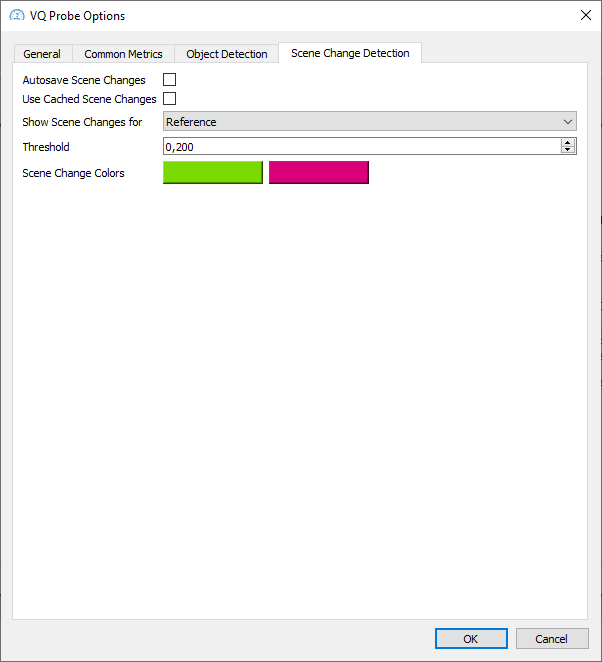
Please note that the Scene Change Detection tab is not accessible during the detection. Uncheck the Tools > Show Scene Changes menu item or wait for the detection to finish to access the tab.
To restore the default options, use Tools > Restore Default Options.
Command Line Interface
Once you activate your copy of VQ Probe, you can use the Command Line Interface (CLI) of the app. You can find it near the main executable of VQ Probe (in VQProbe.app/Contents/MacOS on macOS). The CLI executable is called VQProbeConsole.
The CLI is used to calculate metrics and store them in JSON and CSV. These are the options of the CLI.
Information:
- -h: display help information
- -v: display version information
- --list-metrics: display supported metrics
- --list-codecs: display supported codecs
- --list-containers: display supported containers
- --list-calc-modes: display supported calculation modes
Activation:
- --credentials: enter the credentials (like this: ip:port) to register your copy of VQ Probe
- --proxy: use a proxy when activating your copy. Pass system to use a system proxy, or ip:port@user:password to use a manually set proxy. Used with --credentials
Options related to projects:
- --create: create an empty project file
- --use-config: use a config file (see the Config File section below) to set up a project file. Used with --create (create a project) or -d (calculate metrics without saving a project file)
- -p: path to an existing project file. If passed without any other options, -p will print a brief summary of the project file
If you want to add or remove a source file, use the following options:
- -a: add a file to the project file. Must be used with -p
- --validate: validate an added file. Used with -a
- --yuv-params: pass the parameters of a YUV file (like this, in quotes: “width;height;pixfmt;framecount”. For pixfmt we use FFmpeg names of formats, see this source code for more information). Used with -a
- -t: set the type of an added file; use ref to set the file as Reference, or use name_of_RD_curve to add the file to an RD Curve. Used with -a
- --stream-id: select a stream (by ID) from an added container file. Used with -a
- -c: set the codec of an added file; use one of these: avc, hevc, vvc, av1, av2, avs3, mjpeg, mpeg2, vp9, image, or raw. Used with -a
- --trim: set the Start/End frame numbers of an added file. Used with -a
- -r: remove a file from the project file. Must be used with -p
You can also use these options to quickly add 2 streams and calculate metrics:
- --reference: add a reference file to a temp project. Used with --distorted and --enable-<metric>. Compatible with --yuv-params, --stream-id, --codec, and --trim
- --distorted: add a distorted file to a temp project. Used with --reference and --enable-<metric>. Compatible with --yuv-params, --stream-id, --codec, and --trim. Multiple distorted are supported
To calculate metrics, use these options:
- -d: path to an output folder (default is current path)
- --enable-psnr-y: enable PSNR: Y
- --enable-psnr-uv: enable PSNR: U, PSNR: V, PSNR: YUV. Used with --enable-psnr-y
- --enable-apsnr: enable APSNR. Used with --enable-psnr-y
- --enable-ssim: enable SSIM
- --enable-vmaf: enable VMAF
- --enable-cambi: enable CAMBI
- --enable-ciede: enable CIEDE2000
- --enable-ms-ssim: enable MS-SSIM
- --enable-psnr-hvs: enable PSNR-HVS
- --enable-vmaf-neg: enable VMAF-NEG
- --enable-xpsnr: enable XPSNR
- --siti: calculate SI/TI. Not compatible with --buffer-info and --enable-<metric> options
- --calc-mode: set the calculation mode; use one of these: ipp (default), cm, opencl, plain. Used with --enable-<metric> or --siti
- --dev: set a device ID for Intel(R) CM / OpenCL calculation modes; use –list-calc-modes to get a list of devices. Used with --calc-mode
- --set-anchor: set the anchor RD Curve. Used with --enable-<metric>
- --enable-convex-hull: enable Convex Hull. Used with --enable-<metric>
- --scaling-mode: set the scaling mode for Convex Hull; use one of these: fast_bilinear, bilinear, bicubic, lanczos (default). Used with --enable-convex-hull
- --use-roi: use ROIs from a COCO JSON file. Used with --enable-<metric>
- --use-cache: use the project cache to load metrics without recalculating them. Used with --enable-<metric>
- --dont-update: don’t update the project file (i.e. don’t set the new results as the project’s cache). Used with --enable-<metric>
Stream information:
- --buffer-info: extract stream buffer level information as JSON. Not compatible with --siti and --enable-<metric> options
Miscellaneous options:
- -y: overwrite output files. Used with --create or -d
- --verbose: print the project file as JSON. Used with -p
NOTE: The -a and -r options support wildcards: -p test.vqprb -a *.h264 -t curve_avc. On Linux and macOS, wildcards must be enclosed in single quotes.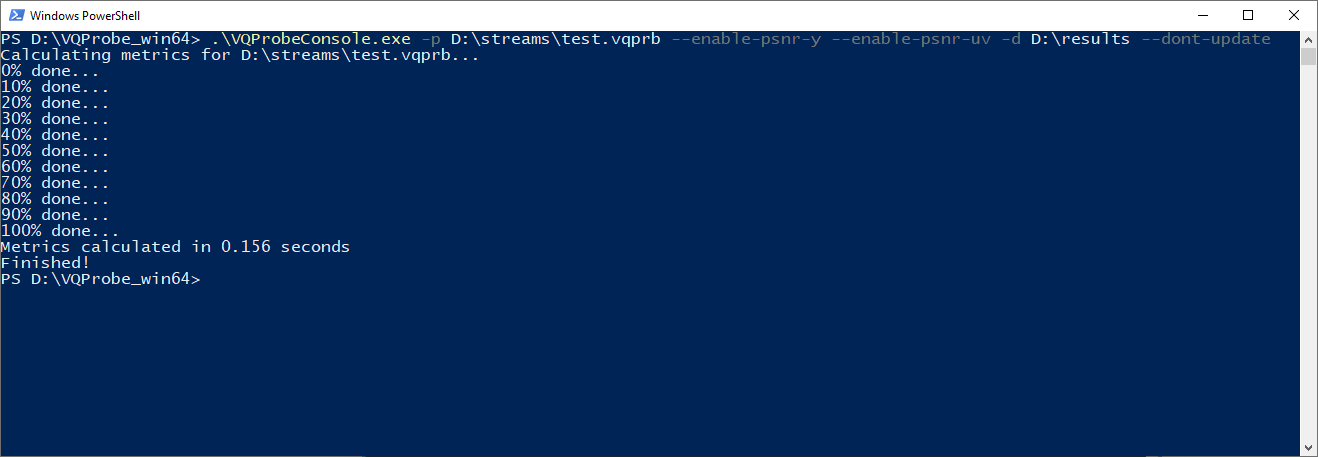
Config File
A config file is a CSV file that is used to set up a project from scratch. It consists of 7 columns:
- Filename (full path)
- Type: ref or name_of_RD_curve to add to
- Width
- Height
- Codec (AVC, HEVC, VVC, AV1, AV2, AVS3, MJPEG, MPEG2, VP9, IMAGE, or RAW)
- Pixel format: we use FFmpeg names of formats, see this source code for more information.
- Number of frames
Here is an example of a config file:
D:/streams/apple.yuv;ref;832;480;yuv;yuv420p;100
D:/streams/apple.h264;rd-curve-1;832;480;avc;yuv420p;100
Pass a config file with the –use-config option to set up your project.
Known Limitations
- If you want to set streams of different resolutions as Left and Right, you must either set a stream with higher resolution as Left or use L|R Scale Mode > Scale to Higher Resolution (see the L|R Scale section for more information).
- VQ Probe will use only the first temporal layer of a VVC stream with multiple layers
- If you encounter the message “Cannot create a lock file: permission error”, try running VQ Probe as root
- Scaling of streams (used for L|R Scale Mode and Convex Hull) can produce different results on different operating systems. This issue comes from FFmpeg
Bug Report
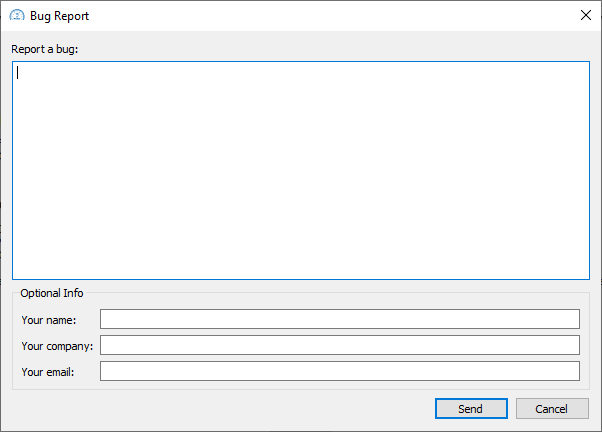
If you encounter a bug, you can report it to us by mail (customersupport@vicuesoft.com) or through the Bug Report dialog. To open the dialog, go to Help > Report a Bug. Describe the found bug, optionally, leave information about yourself, and click Send.
Legal
INFORMATION IN THIS DOCUMENT IS PROVIDED IN CONNECTION WITH VICUESOFT PRODUCTS. NO LICENSE, EXPRESS OR IMPLIED, BY ESTOPPEL OR OTHERWISE, TO ANY INTELLECTUAL PROPERTY RIGHTS IS GRANTED BY THIS DOCUMENT. EXCEPT AS PROVIDED IN VICUESOFT’S TERMS AND CONDITIONS OF SALE FOR SUCH PRODUCTS, VICUESOFT ASSUMES NO LIABILITY WHATSOEVER AND VICUESOFT DISCLAIMS ANY EXPRESS OR IMPLIED WARRANTY, RELATING TO SALE AND/OR USE OF VICUESOFT PRODUCTS INCLUDING LIABILITY OR WARRANTIES RELATING TO FITNESS FOR A PARTICULAR PURPOSE, MERCHANTABILITY, OR INFRINGEMENT OF ANY PATENT, COPYRIGHT OR OTHER INTELLECTUAL PROPERTY RIGHT. UNLESS OTHERWISE AGREED IN WRITING BY VICUESOFT, THE VICUESOFT PRODUCTS ARE NOT DESIGNED NOR INTENDED FOR ANY APPLICATION IN WHICH THE FAILURE OF THE VICUESOFT PRODUCT COULD CREATE A SITUATION WHERE PERSONAL INJURY OR DEATH MAY OCCUR.
VICUESOFT may make changes to specifications and product descriptions at any time, without notice. Designers must not rely on the absence or characteristics of any features or instructions marked “reserved” or “undefined”. VICUESOFT reserves these for future definition and shall have no responsibility whatsoever for conflicts or incompatibilities arising from future changes to them. The information here is subject to change without notice. Do not finalize a design with this information.
The products described in this document may contain design defects or errors known as errata which may cause the product to deviate from published specifications. Current characterized errata are available on request.
Contact your local VICUESOFT sales office or your distributor to obtain the latest specifications and before placing your product order.
MPEG is an international standard for video compression/decompression promoted by ISO. Implementations of MPEG CODECs, or MPEG enabled platforms may require licenses from various entities, including VICUESOFT.
*Other names and brands may be claimed as the property of others. Copyright © 2020-2023, VICUESOFT Ltd. All Rights reserved.
Third Party Libraries
VQ Probe uses certain third party libraries, as listed below. You may find the full text of each license in the following folder: Windows/Linux – the licenses folder in your application’s folder; macOS – VQProbe.app/Contents/SharedSupport/licenses.
Qt
Qt is licensed under the GNU Lesser General Public License (LGPL) version 3.
Project homepage https://www.qt.io/, upstream version: 5.15.2.
Copyright (C) 2020 The Qt Company Ltd and other contributors
You may find the full text of the license in the Qt_license file of your binary package.
Qwt
Qwt is licensed under the Qwt License, Version 1.0.
Project homepage https://qwt.sourceforge.io/, upstream version: 6.2.0.
Copyright (c) 2021 Uwe Rathmann
You may find the full text of the license in the qwt_license file of your binary package.
FFmpeg
FFmpeg is licensed under the GNU Lesser General Public License (LGPL) version 2.1.
Project homepage https://ffmpeg.org, upstream version: 4.4.1.
Copyright (c) 2000-2021 the FFmpeg developers
You may find the full text of the license in the ffmpeg_license file of your binary package.
Libvmaf
Libvmaf is licensed under the BSD+Patent License.
Project homepage https://github.com/Netflix/vmaf, upstream version: 3.0.0.
Copyright (c) 2020 Netflix, Inc.
You may find the full text of the license in the libvmaf_license file of your binary package.
VVCSoftware_VTM
VVCSoftware_VTM is licensed under the BSD License.
Project homepage https://vcgit.hhi.fraunhofer.de/jvet/VVCSoftware_VTM, upstream version: 22.0.
Copyright (c) 2010-2022, ITU/ISO/IEC
You may find the full text of the license in the libvvc_license file of your binary package.
Dav1d
dav1d is licensed under the BSD 2-clause “Simplified” License.
Project homepage https://code.videolan.org/videolan/dav1d, upstream version: 1.4.0.
Copyright © 2018-2019, VideoLAN and dav1d authors
You may find the full text of the license in the dav1d_license file of your binary package.
AOM
AOM is licensed under the BSD 2-clause “Simplified” License.
Project homepage https://aomedia.googlesource.com/aom, upstream version: 098800de270662bc2247571b89a2adf2750be03a.
Copyright © 2016, Alliance for Open Media.
You may find the full text of the license in the libaom_license file of your binary package.
AVS3
AVS3 is licensed under the BSD License.
Project homepage http://www.avs.org.cn/english/AVS3_introduce.asp, upstream version: 15.2.
Copyright (c) 2018, HUAWEI TECHNOLOGIES CO., LTD. All rights reserved. Copyright (c) 2018, SAMSUNG ELECTRONICS CO., LTD. All rights reserved. Copyright (c) 2018, PEKING UNIVERSITY SHENZHEN GRADUATE SCHOOL. All rights reserved. Copyright (c) 2018, PENGCHENG LABORATORY. All rights reserved.
You may find the full text of the license in the avs3_license file of your binary package.
IPP
IPP is licensed under the Intel Simplified Software License (Version August 2021).
Project homepage https://www.intel.com/content/www/us/en/developer/tools/oneapi/ipp.html, upstream version: 2021.6.0.
You can get IPP separately or as a part of Intel oneAPI Base Toolkit.
Copyright (c) 2021, Intel Corporation.
You may find the full text of the license in the ipp_license file of your binary package.
XPSNR
XPSNR is licensed under the BSD 3-clause License.
Project homepage https://github.com/fraunhoferhhi/xpsnr, upstream version: 1.2.
Copyright © 2019 - 2021 Fraunhofer-Gesellschaft zur Foerderung der angewandten Forschung e.V. (Fraunhofer).
You may find the full text of the license in the xpsnr_license file of your binary package.
zlib
zlib is licensed under the zlib License.
Project homepage https://www.zlib.net/zlib.html, upstream version: 1.3.
Copyright (C) 1995-2023 Jean-loup Gailly and Mark Adler
You may find the full text of the license in the zlib_license file of your binary package.