Customer Service at ViCueSoft: Hardware assisted (Intel® Media SDK) video pipeline

Hi,
My name is Evgeny. I am a Consulting Services Manager at ViCueSoft. In my role, I regularly assist customers with their video compression tasks and work tirelessly to ensure that they receive the ace user experience they deserve. Here, I’d like to demonstrate one of the user cases that we solved.
Introduction:
Live streaming using mobile devices such as smartphones is the norm in today’s world. Such transmission method may seem routine to an average smartphone user, but the underlying engineering challenges are complex. The volume of traffic is enormous and users demand speed and precision. Given the constraints of network bandwidth (4G/5G/WiFi) and reliability, a key engineering challenge is to transform the nature of the video data and deliver best possible user experience.
The following example would perhaps illustrate the challenges associated with network bandwidth inconsistencies. Suppose, you are streaming a live feed while travelling on a suburban train and suddenly you hit a tunnel. In an instant, the signal strength drops and the software would need to react rapidly in order to ensure uninterrupted transmission without minimal impact on stream’s visual quality.
Paraphrasing the abovementioned use case as a technical task we get the following input data:
- Pipeline: 1080i@60fps live encoding and streaming — 16ms for one field.
- Encoder: Intel Gen graphics.
- Linux Media stack: Intel Media SDK, libVA, iHD UMD, libDRM, i915 KMD.
- Problem: Live broadcasting over a fluctuating network and slow encoder adaptation to the changing network conditions.
For better understanding of our approach let me briefly introduce the video compression basics here.
Intuitively, video is a sequence of static pictures which follow each other over time. When we are talking ‘video compression’, our aim is to reduce the size of video data to the target size all the while not unduly compromising visual quality.
Why do we need video compression after all? The principal reason is that uncompressed video occupies enormous network space. For example, a 90-minute 1080p video at 24 fps would need around 750 Gb of storage space. There is no network which could handle such amount of data. To handle such a technical challenge, various techniques and algorithms are developed.
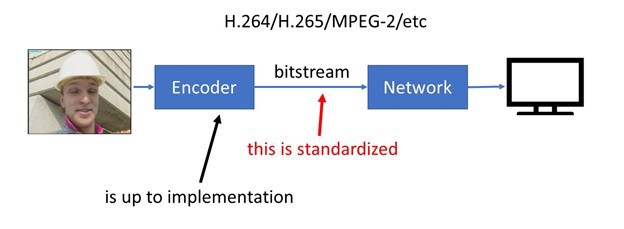
To allow interoperability among various devices those techniques are standardized in the form of codec standard: AVC/H.264, HEVC/H.265, AV1 and so on. However, these standards only describe syntax and semantics of the compressed video bitstreams. The production of standard-compliance bitstream is entirely up to the video encoder developer.
What are the common blocks of video encoders?
From variety of techniques there are two modules in focus: Rate-control and Mode-Decision.
- Rate control ensures that the size of compressed bitstream is under bandwidth/size constraints. E.g. we could burn a produced bitstream on a standard CD-ROM.
- Mode-decision chooses the best compression technique for every temporal and spatial part of the current video sequence. It’s a complex optimization problem where the developer is at liberty to invent his/her own techniques and heuristics. The alternative brute force approach is extremely resource and time intensive.
Let’s review the following image. We have an encoder, which has four compression techniques denoted by Tis, i = 1..4.
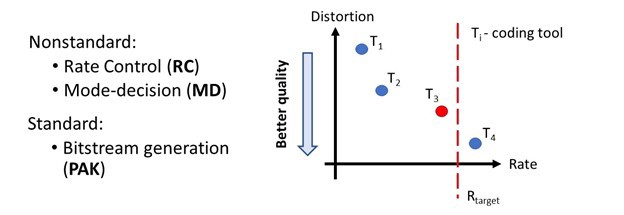
Note that Rtarget is the constraint on the output stream size. Thus, in our example Mode-decision module should choose mode T3. Modes T1 and T2provide worse quality and T4 doesn’t satisfy size restrictions. The encoder would need to decide on these modes quickly as there are more frames to encode.
Following the decisions we would need to generate output bitstream. It is a fairly straightforward and somewhat mundane task.
As we are using hardware-based encoder let’s review how it is implemented.
In our case we use Intel® chip with Skylake® microarchitecture and Gen9 GT2 graphics subsystem. Following is a scheme from the official manual.
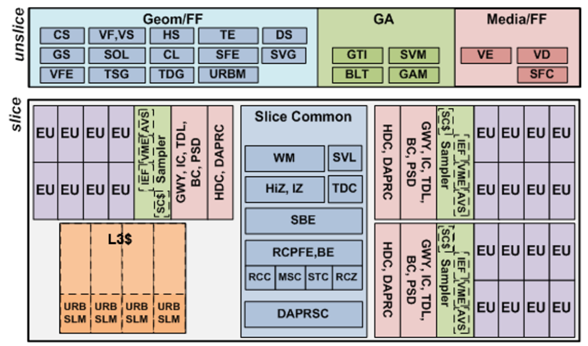
We can split the whole system into two blocks:
- Slice — a set of programmable shader units for General-purpose computing on graphics processing units (GP GPU).
- Unslice — a set of fixed function pipelines for media operations, which includes MFX blocks that provide video compression capabilities.
Now let’s combine our theoretical knowledge and hardware in order to construct a two steps video encoding architecture.
- First step is to implement mode decision and deliver rate control optimization tasks. We implement this on shader units.
- The second step is to create the final bitstream based on the decisions from the first step. This step is performed on dedicated hardware MFX blocks.
Pipeline optimization.
It was a long journey but in short here is what we have done:
- new rate control with better handling of network fluctuations,
- new shader kernel to facilitate better decision making by the general mode decision module,
- some minor optimization of the standard media stack.
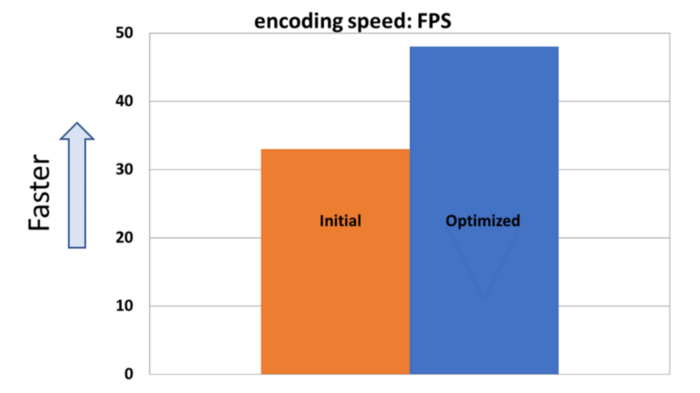
As a consequence, this gives up to 30% performance quality improvement. In other words, a previously encoded 6Mbps bitstream could be now delivered at 4Mbps bandwidth with the same visual quality.
To trace these improvements, we used the effective VQ Probe tool developed by the ViCueSoft team. VQ Probe is a visual instrument for objective and subjective video quality probation. As a tool, it provides a visual quality comparison between two videos using a split-line and various zoom options. Among its multiple exciting functions, there is plotting of RD Curves, calculating BD Rates and evaluating improvements of the video file.
Figure 1 displays a screenshot from the VQ Probe tool demonstrating rd-curves and it also measures the bd-rate for the original and the transformed videos.
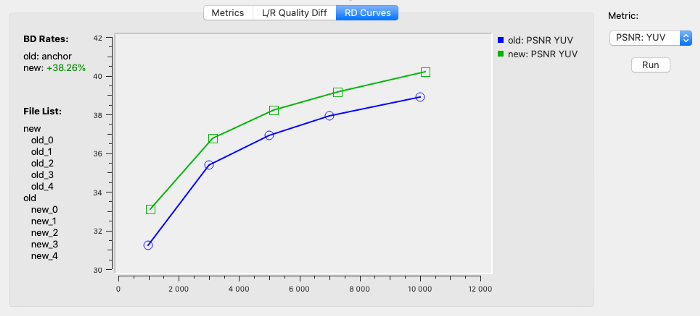
Figure 1. Screenshot of rd-curve from VQ Probe.
Time to celebrate? Not yet, as we encountered new challenges in the form of performance decline and complexity increase. This is due to limitation of the original architecture.
And our best friend here to spot the root cause of the problems and understand underling hardware work is the Intel® VTune analyzer.
Let’s configure VTune to run graphics usage analysis.
After installation we created three scripts:
- VTune analysis configuration script for graphics profiling entitled run_vtune.sh
#!/bin/shusage () {
  echo “Usage: $0 <result_dir_name> [<options>] — <target_app> [<target_app_params>]”
}if [ -z “$VTUNE_AMPLIFIER_XE_2018_DIR” ]
then
echo “Error: Environment variable VTUNE_AMPLIFIER_XE_2018_DIR is not defined. Source amplxe-vars.sh file from VTune directory.”
exit 1
fiTARGET_APP=`echo $@ | sed -ne ‘s/^.* — \(.*\)$/\1/p’`if [ -z “$TARGET_APP” ]
then
  usage
  exit 1
fiRESULTS_NAME=$1if [ -z “$RESULTS_NAME” ] || [ “$RESULTS_NAME” == “ — “ ]
then
  RESULT_OPTIONS=”” #save results to the current folder
else
  RESULT_OPTIONS=”-r $RESULTS_NAME”
fiOPTIONS=`echo $@ | sed -ne ‘s/^\(.*\) — .*$/\1/p’ | awk ‘{first = $1; $1 = “”; print $0;}’`if [ -z “$OPTIONS” ]
thenOPTIONS=” \
-collect-with runsa \
-knob enable-user-tasks=true \
-knob enable-gpu-usage=true \
-knob enable-gpu-runtimes=true \
-knob event-config=CPU_CLK_UNHALTED.REF_TSC:sa=3100000,CPU_CLK_UNHALTED.THREAD:sa=3100000,INST_RETIRED.ANY:sa=3100000 \
-knob gpu-counters-mode=overview \
-knob gpu-sampling-interval=0.1"fiecho
echo “run:”
echo “$VTUNE_AMPLIFIER_XE_2018_DIR/bin64/amplxe-cl $RESULT_OPTIONS $OPTIONS — $TARGET_APP”
echo
$VTUNE_AMPLIFIER_XE_2018_DIR/bin64/amplxe-cl $RESULT_OPTIONS $OPTIONS — $TARGET_APP
2. Script for the application to be profiled. Here we use standard Intel® Media SDK sample. We assume the current directory is media sdk build output. Name it run.sh
#!/bin/sh
export LD_LIBRARY_PATH=`pwd`
export LIBVA_DRIVERS_PATH=/opt/intel/mediasdk/lib64
export LIBVA_DRIVER_NAME=iHD
./sample_encode h264 -i input.yuv -w 1920 -h 1080 -o stream.avc
3. Main script to gather profiling data:
#!/bin/sh
VTUNE_AMPLIFIER_XE_2018_DIR=/opt/intel/vtune_amplifier ./run_vtune.sh vtune -- ./run.sh
If everything is ok, we will get a report under newly created ‘vtune’ folder.
Let’s analyze one of the reports:
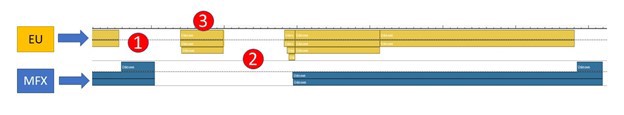
It shows hardware usage pipeline on time scale, where yellow is shader units blocks, and blue — mfx hardware blocks.
Blank (white)– hardware is idle.
The top most blue/yellow rectangle — actual task execution; blocks below the top one — queue waiting for execution or result. E.g. under point “3”: one task on shader unit is executed, one wait for its completion and the next task is in the queue; MFX block is idle.
List of the problems:
- Bad EU/MFX pipeline parallelization. They could work simultaneously. While we generate one field, we could execute decisions on the next.
- General idle process. Hardware do nothing which is inefficient.
- Here is our new kernel, which is too slow.
Using such visually informative profiling results representation and following several trials of “optimization — profile — analyze” loops we finally solve majority of our problems.
And here is the result following all optimizations (with CPU traces):
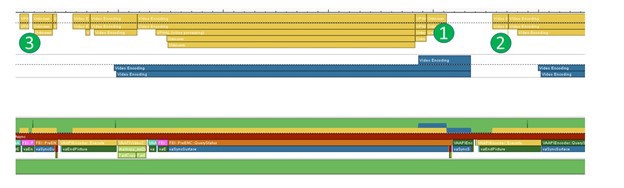
- EU/MFX pipelines are paralleled.
- Better hardware utilization achieved with much less idle time.
- We split our kernel into two simpler and faster kernels. Together they work faster than the original one.
As a result:
- Solved performance degradation.
- Advanced original quality.
- Created a room for further quality increase by adding some more complexity.
As you can notice from the example above, VTune is a great tool to visualize media pipeline and profile simultaneously CPU and GPU workload. We would certainly recommend it. Hopefully you have found this article useful. Please feel free to get in touch with questions and comments. That’s all for now. Stay connected!