VQ Analyzer — Guided Tour. Part Two. “Frame View” Functionality

Welcome to the second part of our VQ Analyzer (Video Codec Analyzer) — Guided Tour!
Still not familiar with VQ Analyzer?
Then I recommend you give the first part of our Guided Tour a read. Briefly, VQ Analyzer is a tool that supports many video codec formats such as HEVC/H.265, VP9, AVC/H.264, MPEG2, AV1, and VVC/H.266.
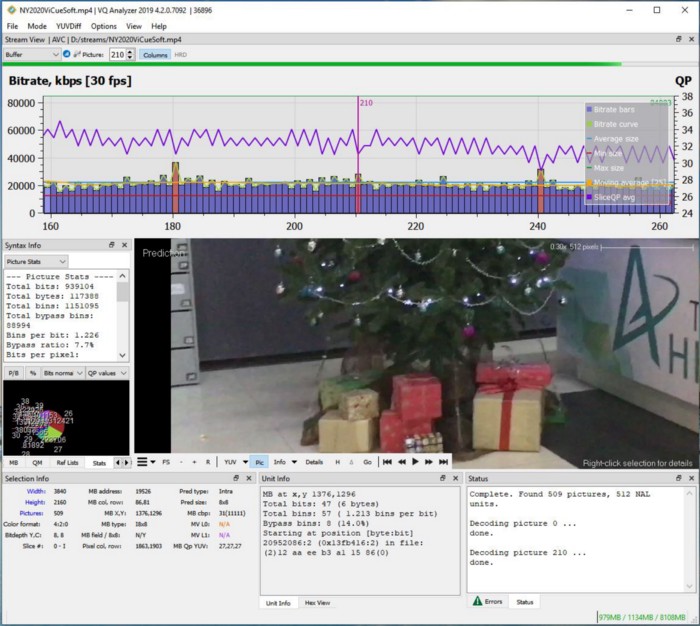
So, if you want to know more information about the frame, this is easy to do. All supported codecs have a Frame-size view. Just open the “Buffer” menu. When you choose the “Buffer” menu from the popup toolbar, the frame size view will appear by default. This is a bar chart plotted with frame sizes. Each bar is colored according to the frame type (for example, red — intra picture I-frame, blue — P-picture, green — B-picture). When you move the mouse along the bar, the current frame is highlighted and the tooltip shows information about the current frame. By clicking on the selected frame, you can decode it.
When you hold down the left mouse button and move it, all plots move along both axes. Double clicking on the canvas area resets plot into the default state. You can zoom in and zoom out with a mouse wheel on both axes when the cursor is inside the canvas. If the mouse is on an axis (below the canvas, for example, x-axis) you can zoom, pan or double click on only on that axis. In that case, all actions are applied to that axis only.
The movement of the plots is restricted to the positive values only; you can’t move or zoom in a negative direction. The currently decoded frame is shown with a vertical line and frame number on it.
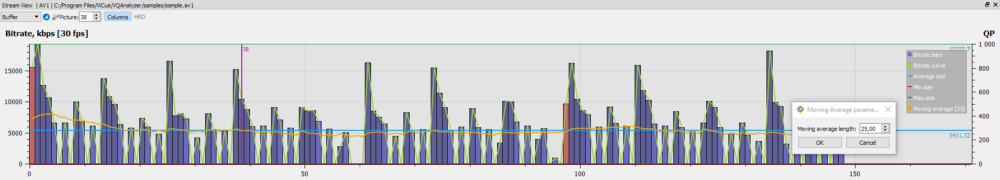
Now let’s move on to some useful details. On the right axis, the average slice QP values are shown. When full stream analysis is complete, the VQ Analyzer adds an average block QP plot that is also attached to the right axis. By double-clicking on ‘Moving average’ label item, sliding window size can be adjusted in the separate dialog box.
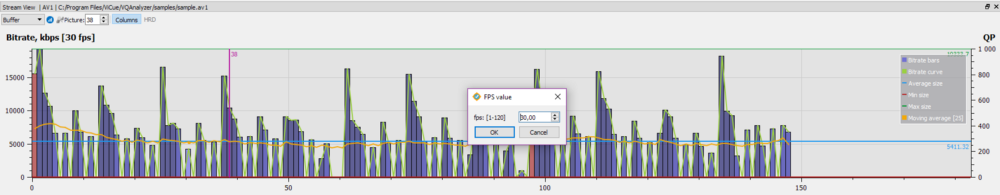
By double-clicking on ‘[30fps]’ label item, the fps value can be adjusted in the separate dialog box. By clicking on legend item one can switch it on or off. The legend panel can be moved by dragging the mouse.
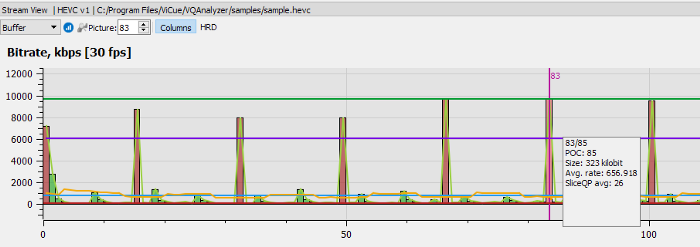
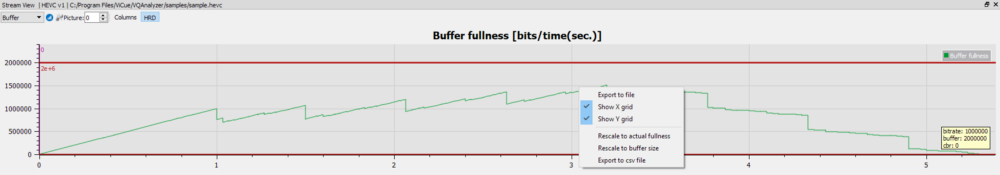
Let me tell you about the “HRD” sub-mode. It is enabled if a stream has HRD buffer fullness plot and works in the same way as for frame size plot. It is possible to get buffer state and picture parameters in each point of the plot where the monotonic behavior changes. With a right-click on the central area of the plot, VQ Analyzer shows additional options for plot adjustment. In the same popup menu, you can export HRD timings into .csv file.
Keep it up! Awesome!
Now you know a bit more about our tool. We will keep you posted and see you soon…