VQ Analyzer — Guided Tour. “YUV Viewer” functionality.

I bet you’ll agree with me that it’s worth visiting unknown interesting places. Especially if you are guided by experienced locals.
With this article, we are starting our series VQ Analyzer (Video Codec Analyzer) — Guided Tour! We will be describing some very interesting but not obvious features of our video bitstream analyzer.
A few words about the VQ Analyzer itself.
The VQ Analyzer is a graphical video bitstream analysis tool, supporting the following video coding standards:
- HEVC: (ISO/IEC 23008–2 MPEG-H Part 2 or ITU-T H.265), 8/10-bit;
- HEVC: RExt extension, 8/10/12-bit, 4:0:0/4:2:0/4:2:2/4:4:4;
- HEVC: SCC extension, conform to HM + SCM 8.6 in reference code;
- HEVC Scalable/Multiview Extension;
- AV1, SHA-1 (Version 1.0.0 Errata.1): add4b15580e410c00c927ee366fa65545045a5d9;
- Google’s VP9, profiles 0,1,2,3, 4:2:0/4:2:2/4:4:0/4:4:4, 8/10/12-bit;
- AVC: (H.264/AVC, ISO/IEC 14496–10, MPEG-4 Part 10);
- MPEG2 (ISO/IEC 13818–2 Part 2), 4:2:0/4:2:2, 8-bit;
- and containers: MKV, MP4, MMT(ARIB STD-B60 1.0), MPEG2 TS/PS, AVI, ASF, FLV, IVF.
Once a bitstream is loaded, the tool allows you to inspect each major step of the decoding process. You can analyze any syntax element graphically and numerically. Each structure of the coded image can be explored. The tool can be used not only for a production purpose when you debug a developed encoder or decoder: owing to the VQ Analyzer’s has extensive visualization ability it can be a great source and reference tool for studying any video codec standards such as HEVC/H.265, VP9, AVC/H.264, MPEG2, AV1, and sooner VVC which will be supported by VQ Analyzer early in 2020.
So. Let’s start our tour!
Our guide for today is Julia Kulygyna one of the software engineers who create and maintain VQ Analyzer. And today’s tour will be of the YUV Viewer.
YUV Viewer
This is part of the VQ Analyzer project and is designed to work with YUV files. In the future, when we talk about the YUV Viewer we will mean one of the VQ Analyzer modules.
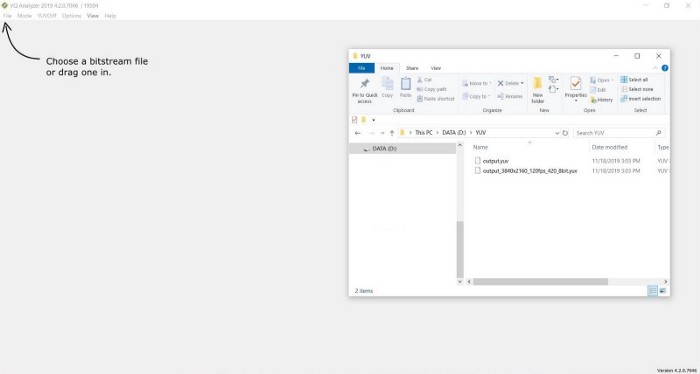
Opening YUV file
YUV Viewer allows you to view various types of raw YUV data. Just drag and drop your YUV file into Analyzer or go through the File menu “Open Bitstream…” item.
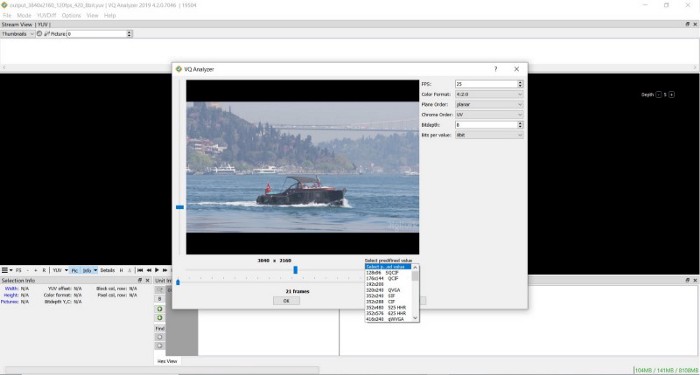
When loading a YUV file, VQ Analyzer will try to guess the height and width by file name. If the file name does not specify the width and height, then VQ Analyzer will prompt you to enter stream parameters, such as width, height, color format, plane order, chroma order, bit depth, bits per value. You can set the width and height using the “Select predefined value” item.
General information
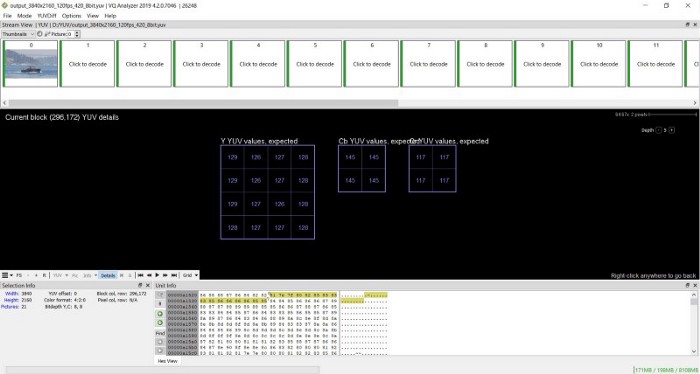
Upon loading the YUV file with the selected parameters, you will see the main panel of the VQ Analyzer.
VQ Analyzer can display general information about the YUV file in the Selection Info section.
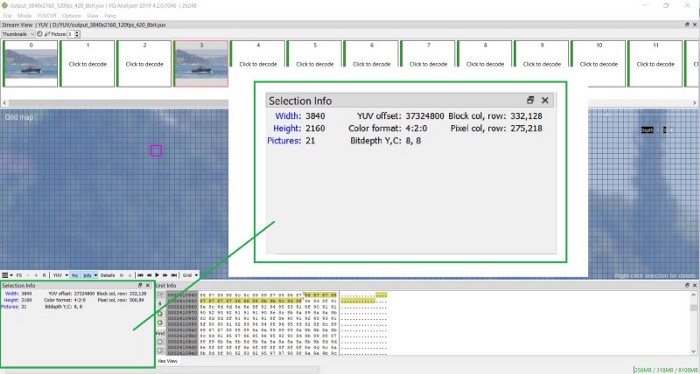
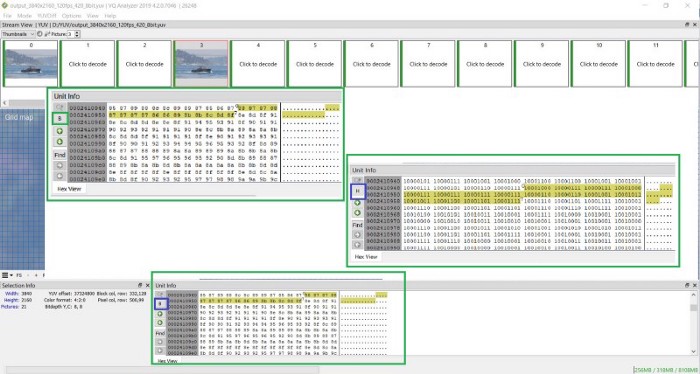
Unit Info
The Unit Info section displays the contents of the file in a hex view, which can be changed to a bin view. Yellow background highlights currently selected block showing start bit position on the first select byte and end bit position on the last selected byte in luma plane.
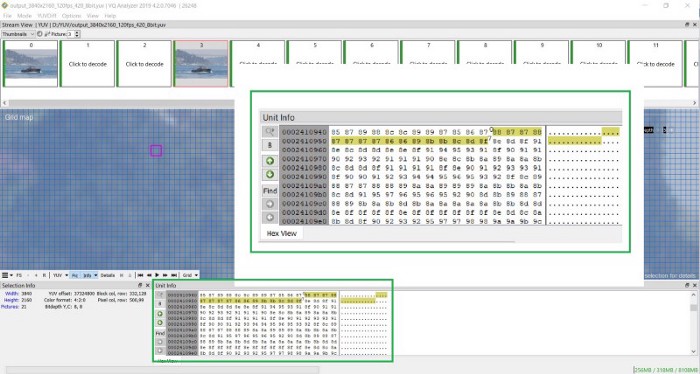
You can change from Hex to Binary presentation of the data in the Unit Info section.
Grid Map
YUV Viewer has one mode — YUV, and three overlay maps: Grid map, PSNR map, and SSIM map.
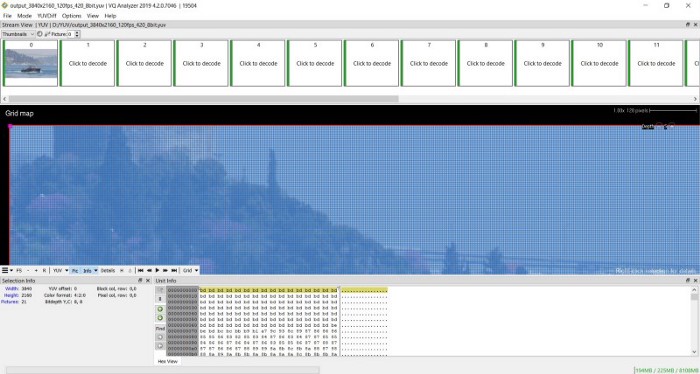
By default, a grid map is displayed in the VQ Analyzer, which allows you to view each frame in a dynamic grid with a block size of 4 × 4 to 128 × 128.
To change Grid (Block size) just change the Depth of deblocking. Depth 0 refers to the highest block size of 128 x 128. And Depth level 5 refers to the minimum block size 4 x 4.
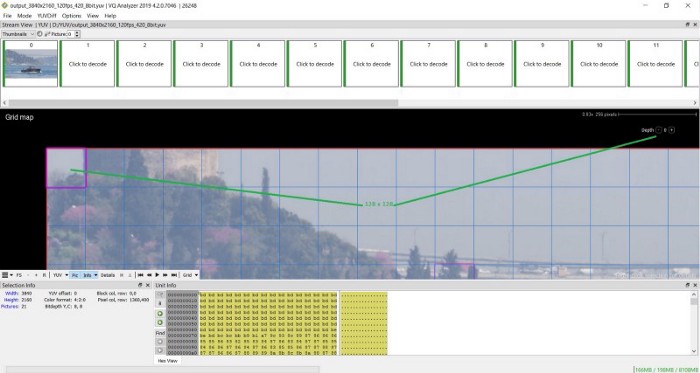
To open a Detailed view of the block right-click on the mouse button and do the same to go back to block the view.
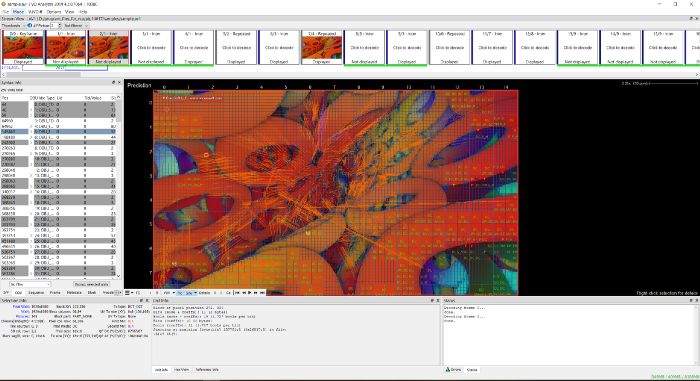
Debug YUV
To open a debug YUV file click to YUVDiff -> Debug YUV… and choose a YUV file that you want to be a debug.
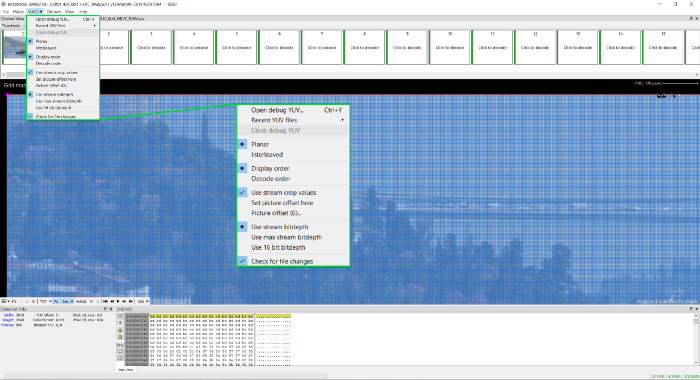
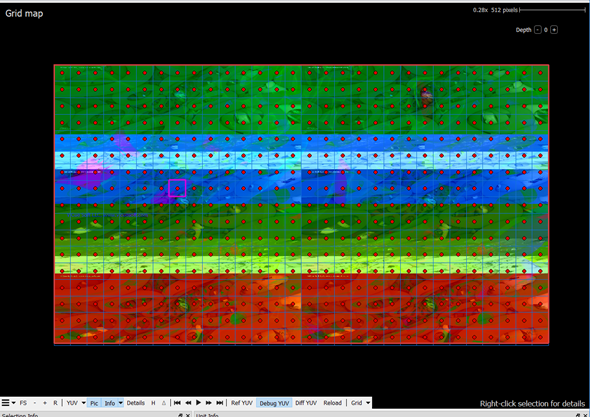
When loading a debug YUV file, in the grid map the red circles show the differences between debug YUV file and reference YUV file. Debug YUV is displayed on the window, which can be switched using the buttons on the bottom panel to Ref YUV and Diff YUV.
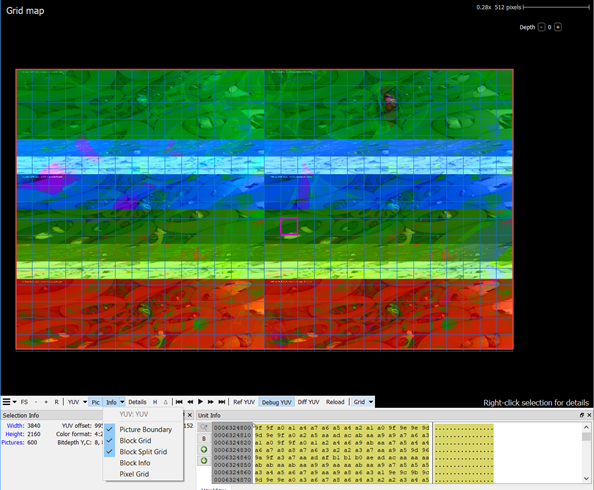
You can remove the display of differences between YUV files by unchecking the checkbox Block Info in the bottom Info panel, where you can configure other layers, such as the picture boundary, block grid, block split grid, pixel grid.
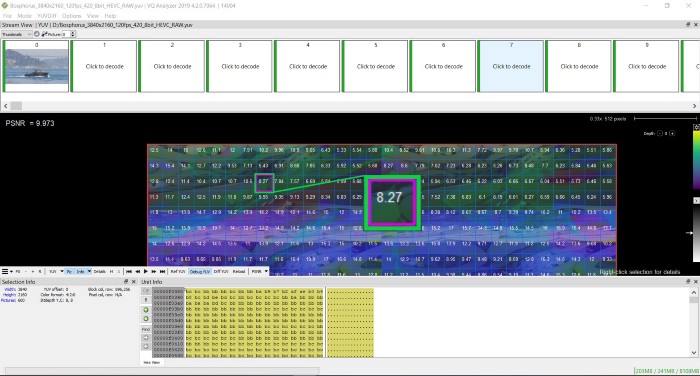
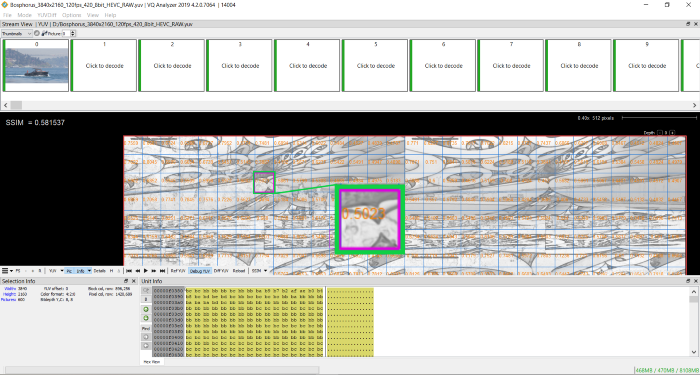
PSNR & SSIM metrics
When loading debug YUV, Info Overlays opens up new possibilities for displaying the PSNR map and SSIM map.
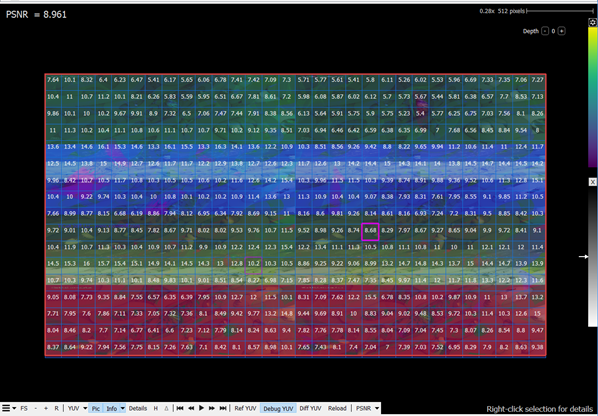
Grids in these PSNR & SSIM modes are also dynamic, and values when resizing grid blocks are recalculated.
Awesome!
We hope this guided tour was interesting and useful. We will shortly be creating the next tour of features of VQ Analyzer.