VQ Probe Advantages

VQ Probe is a professional tool to empower software and hardware engineers, quality assurance technical staff, compression researchers and many others in their deep dive into video quality analysis. It provides a convenient way to compare two videos side-by-side in a split window and to compare uncompressed and encoded videos, as well as displaying video quality metrics. It supports commonly used metrics and the most popular formats.
VQ Probe helps you in the following routines:
- Compare quality of competitive codecs
- Measure video quality and compression
- Compare two implementations of the same codec standard
- Compare two different revisions of your own codec
- Just to playback a video stream
The tool is handy for codec designers, QA engineers, broadcasters, and many others who work in the domain of video.
In this article, we will look at the key features of VQ Probe, such as:
- Objective and subjective assessment of video quality
- Buffer View
- Metrics in a Region of Interest (ROI)
- Convex Hull
- Object Detection
Objective and subjective assessment of video quality
Subjective Assessment
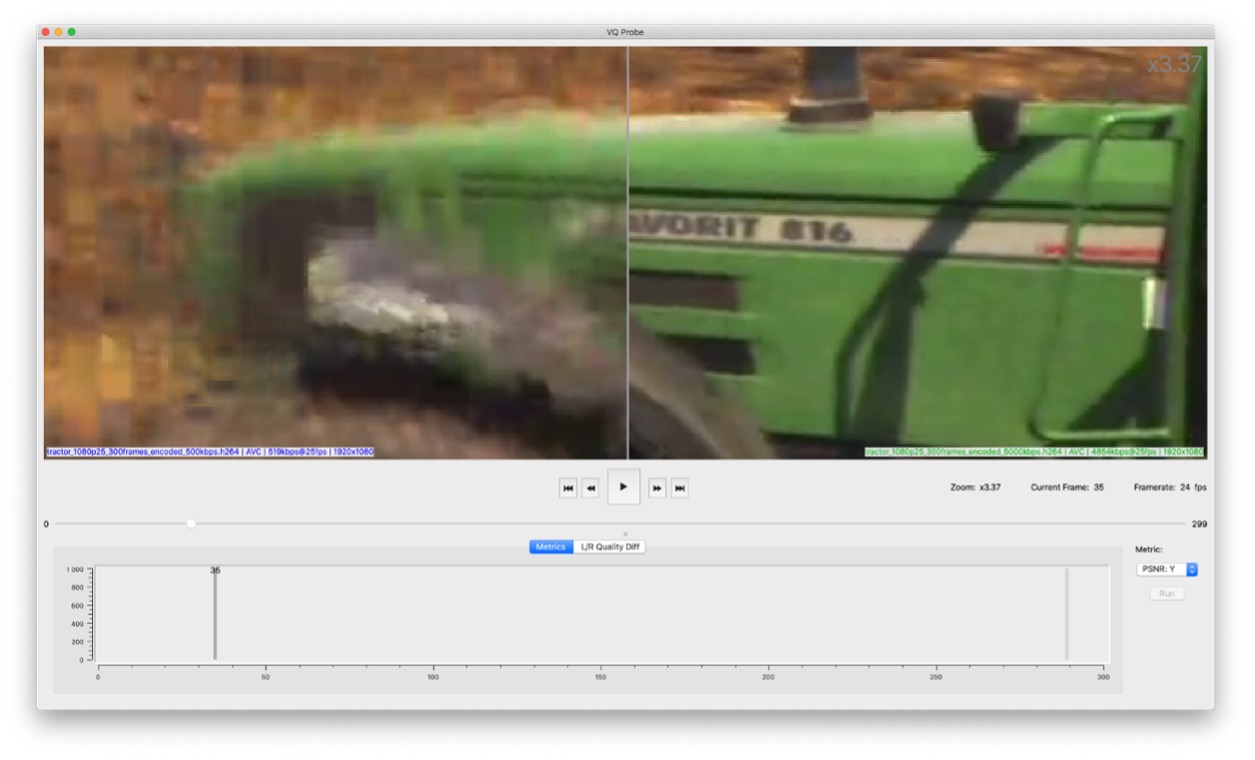
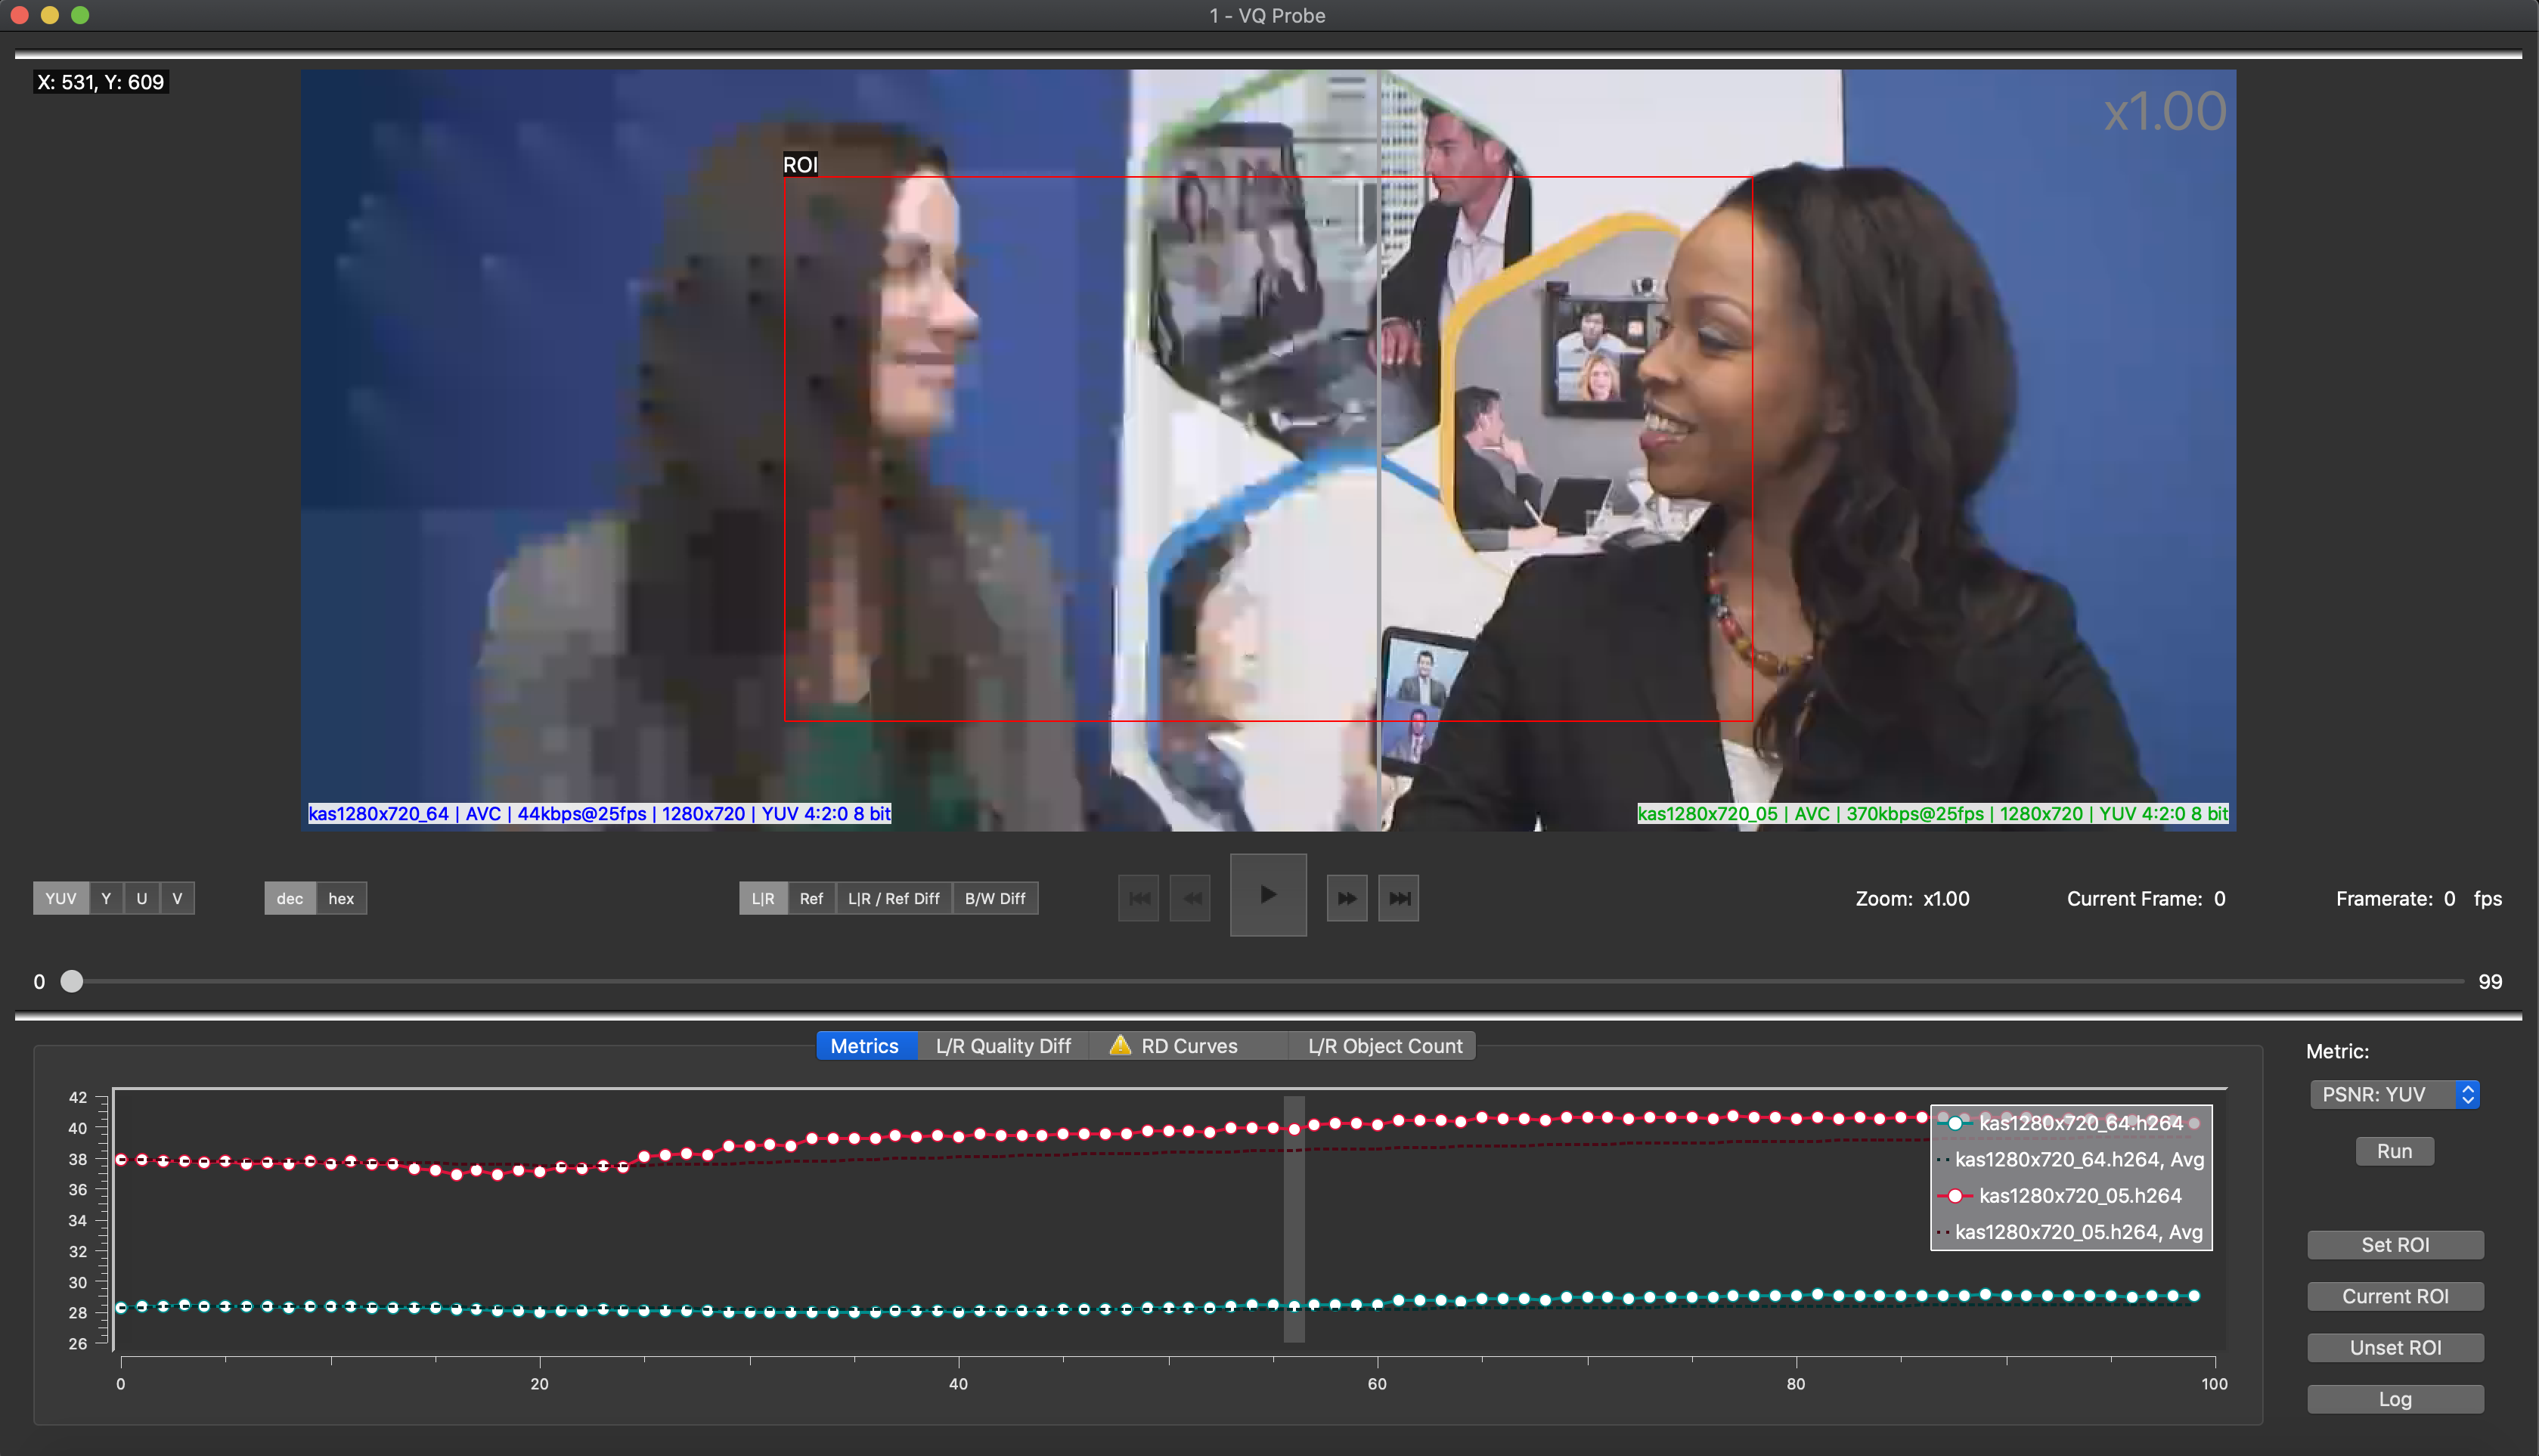
With VQ Probe you can visually compare 2 video streams easily, frame by frame, side by side. Moving the split line, you can observe a difference between frames. Zoom and pan using your mouse or keyboard to navigate to a desired fragment of a frame.
Objective Assessment
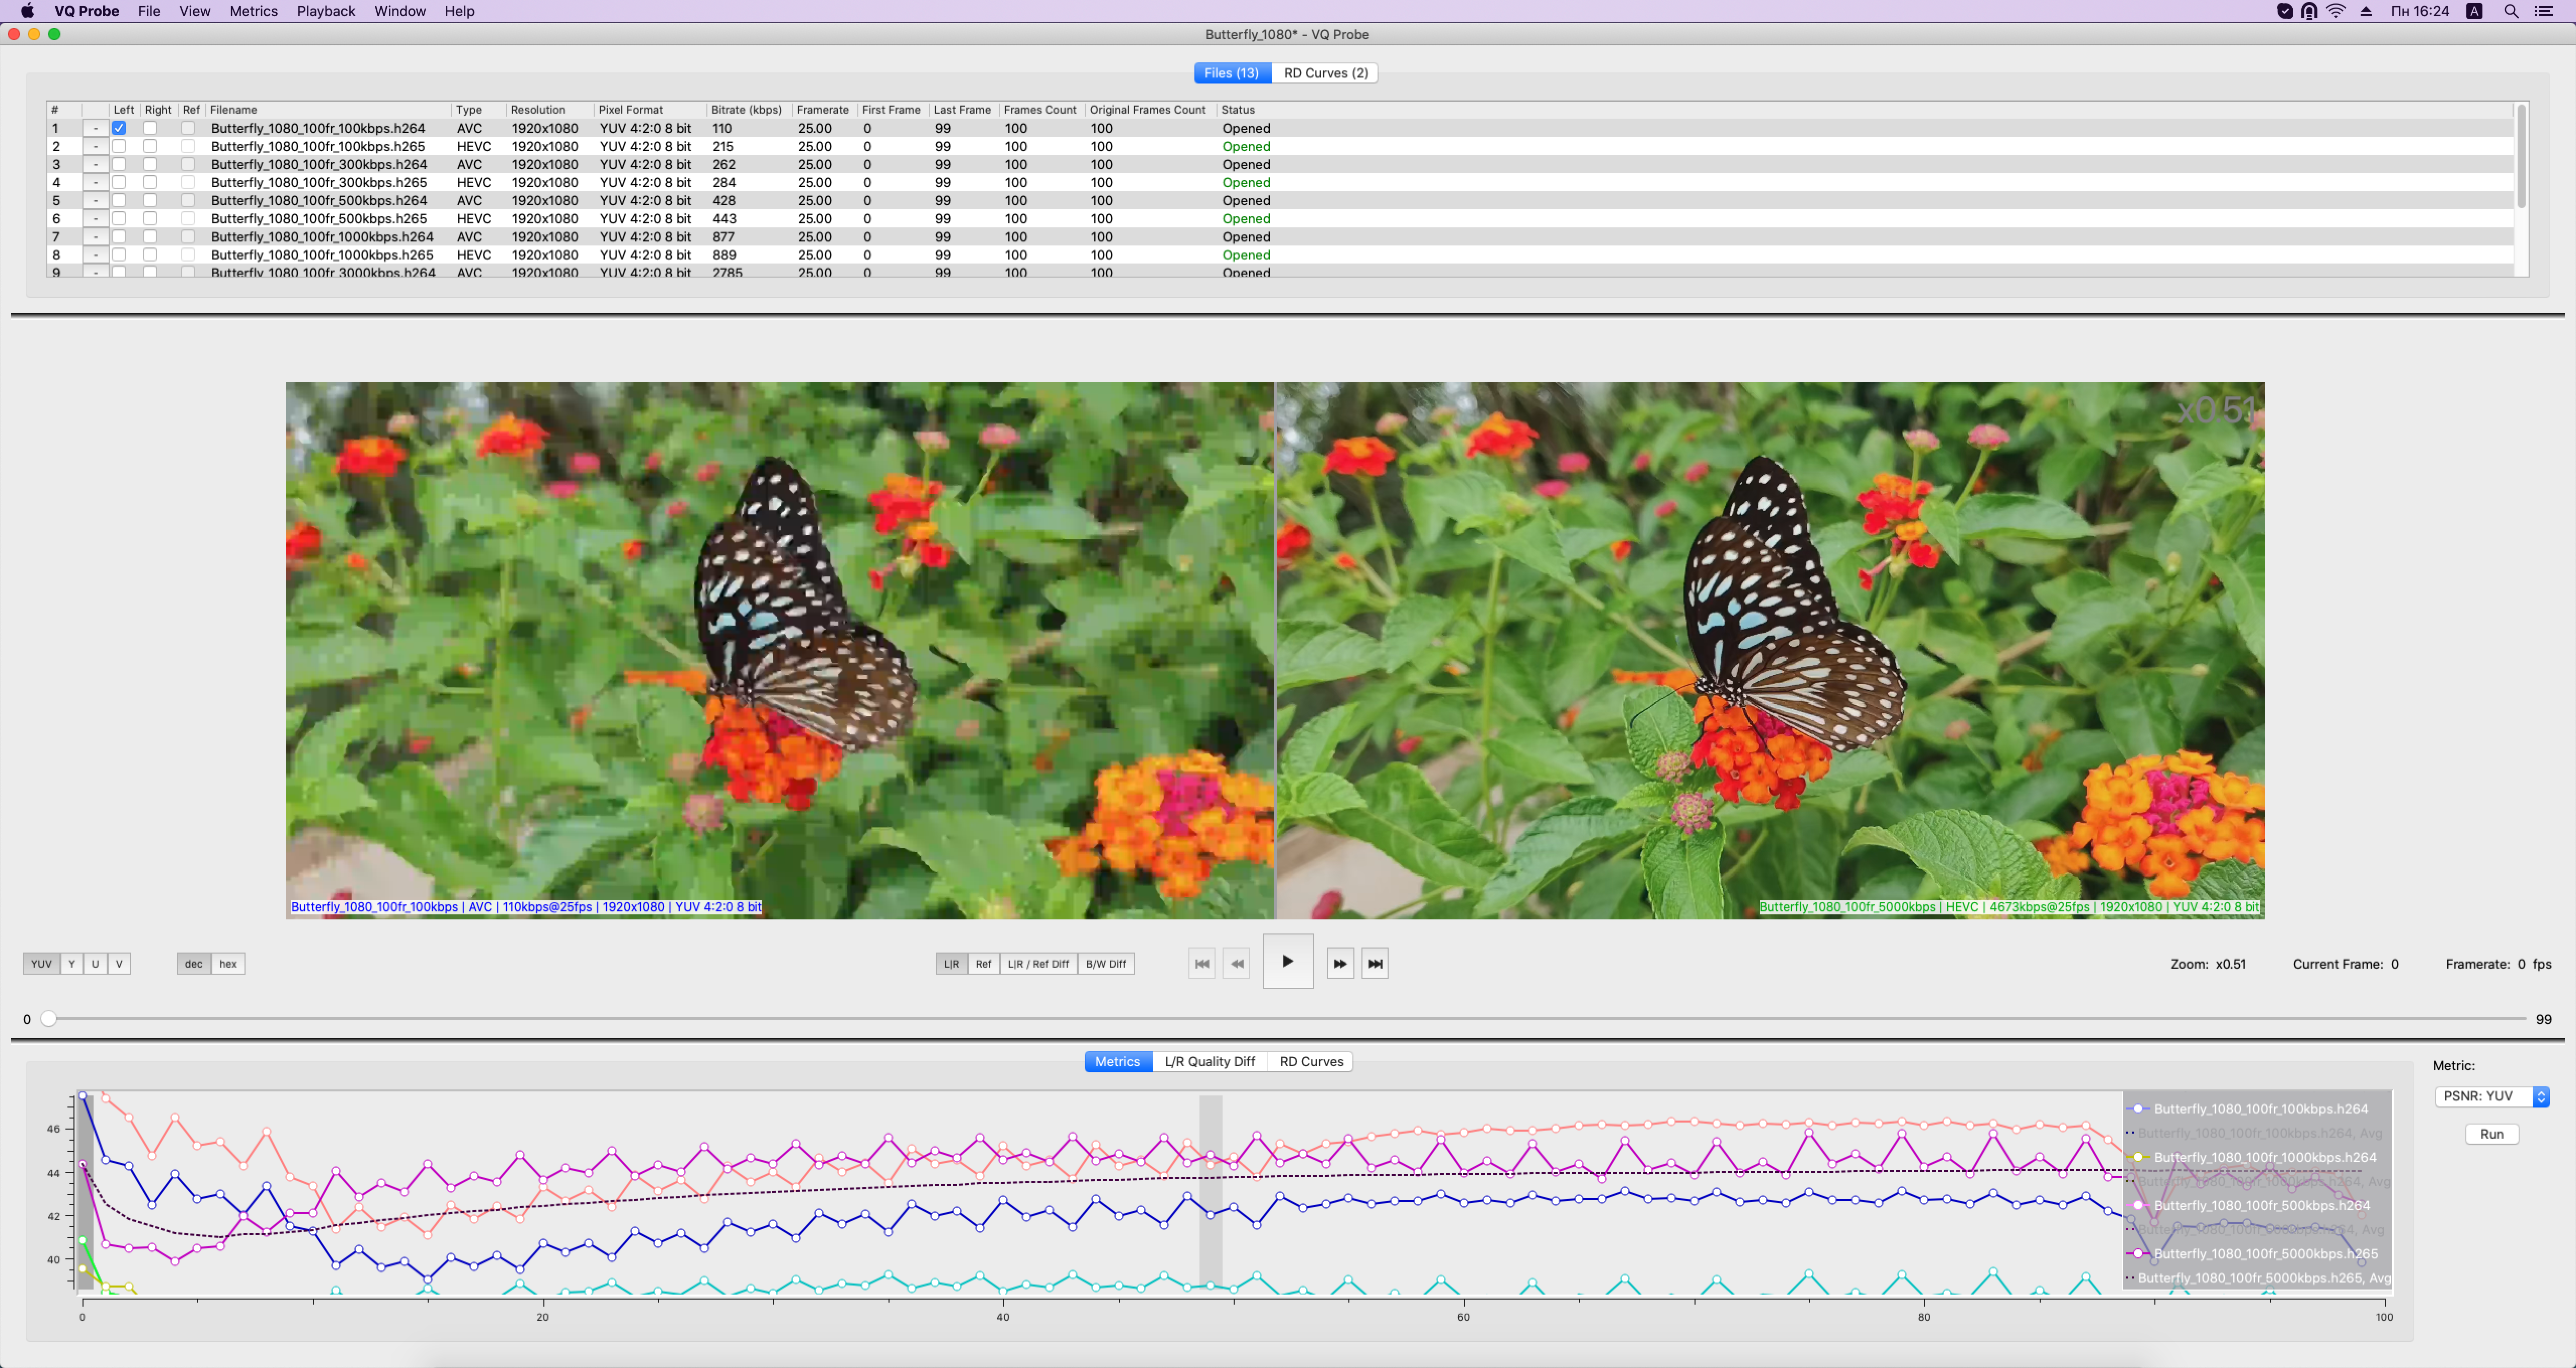
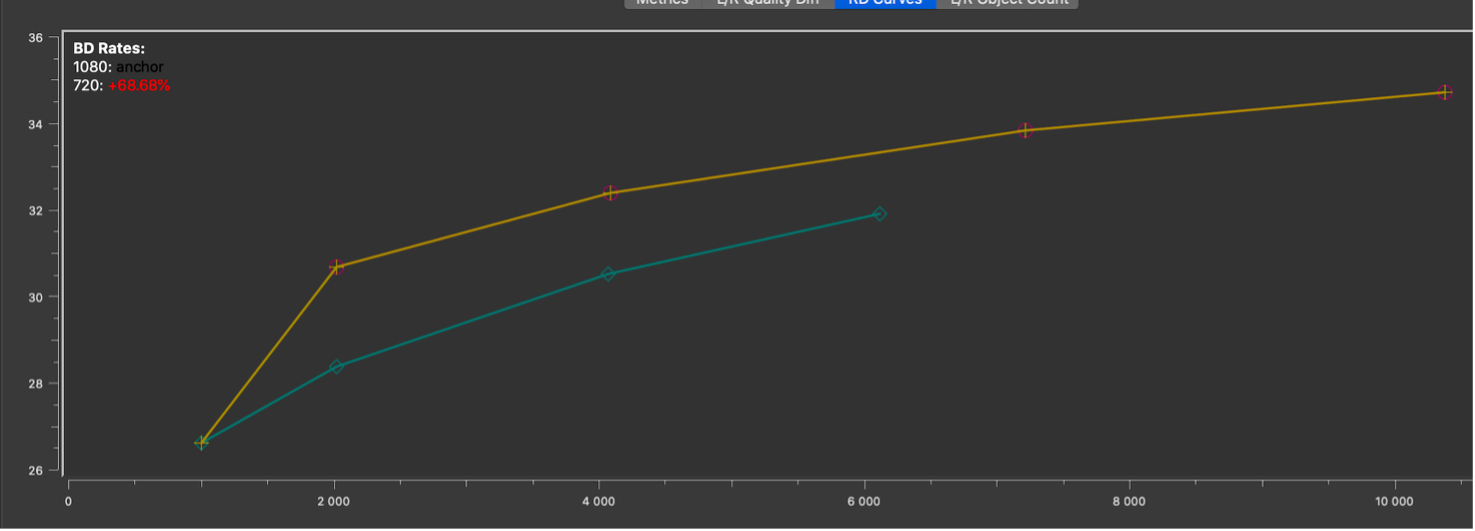
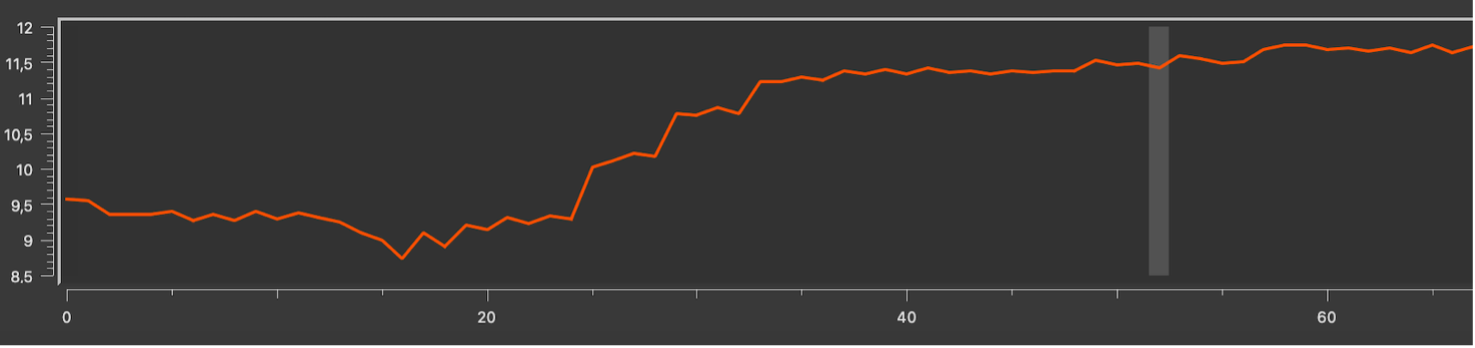
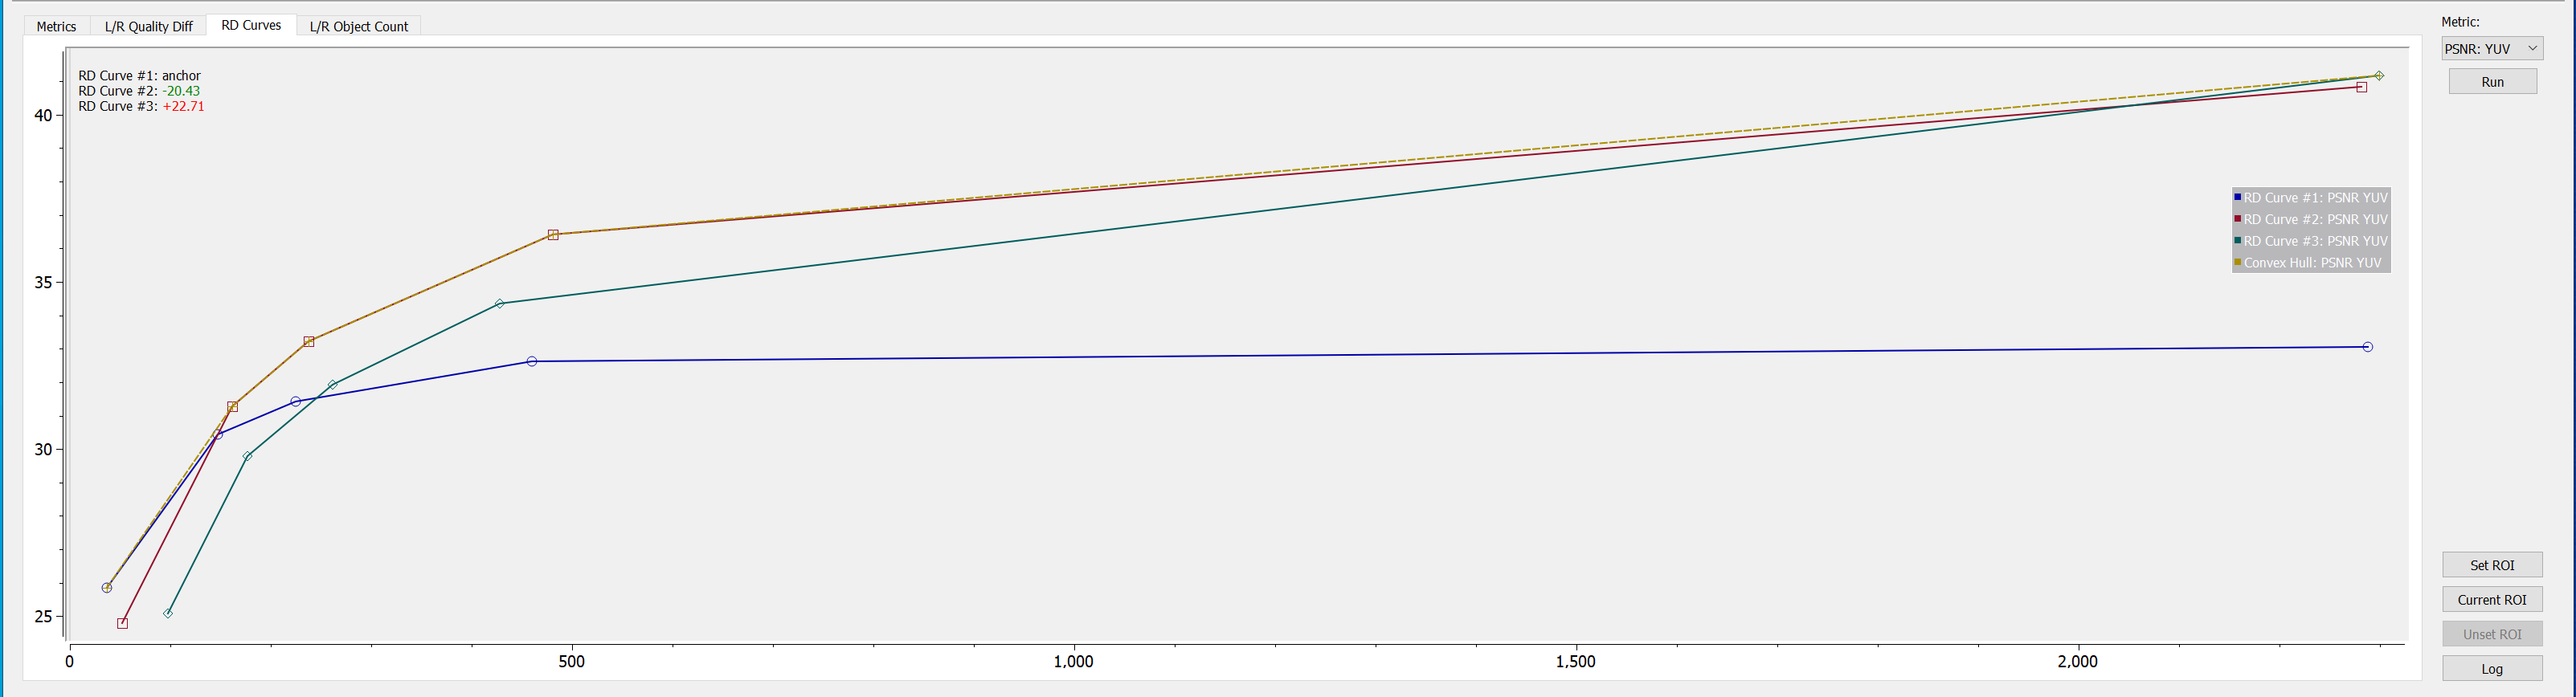
There are old school PSNR and SSIM metrics, and modern VMAF to run objective comparison. Whichever you wish to compare: HEVC vs AV1 or AVC vs VVC, VQ Probe presents a variety of visual tools to display metrics frame by frame or as RD curves, in absolute or difference values.
Quality Diff
Difference and severity of quantization is easy to see with heat maps
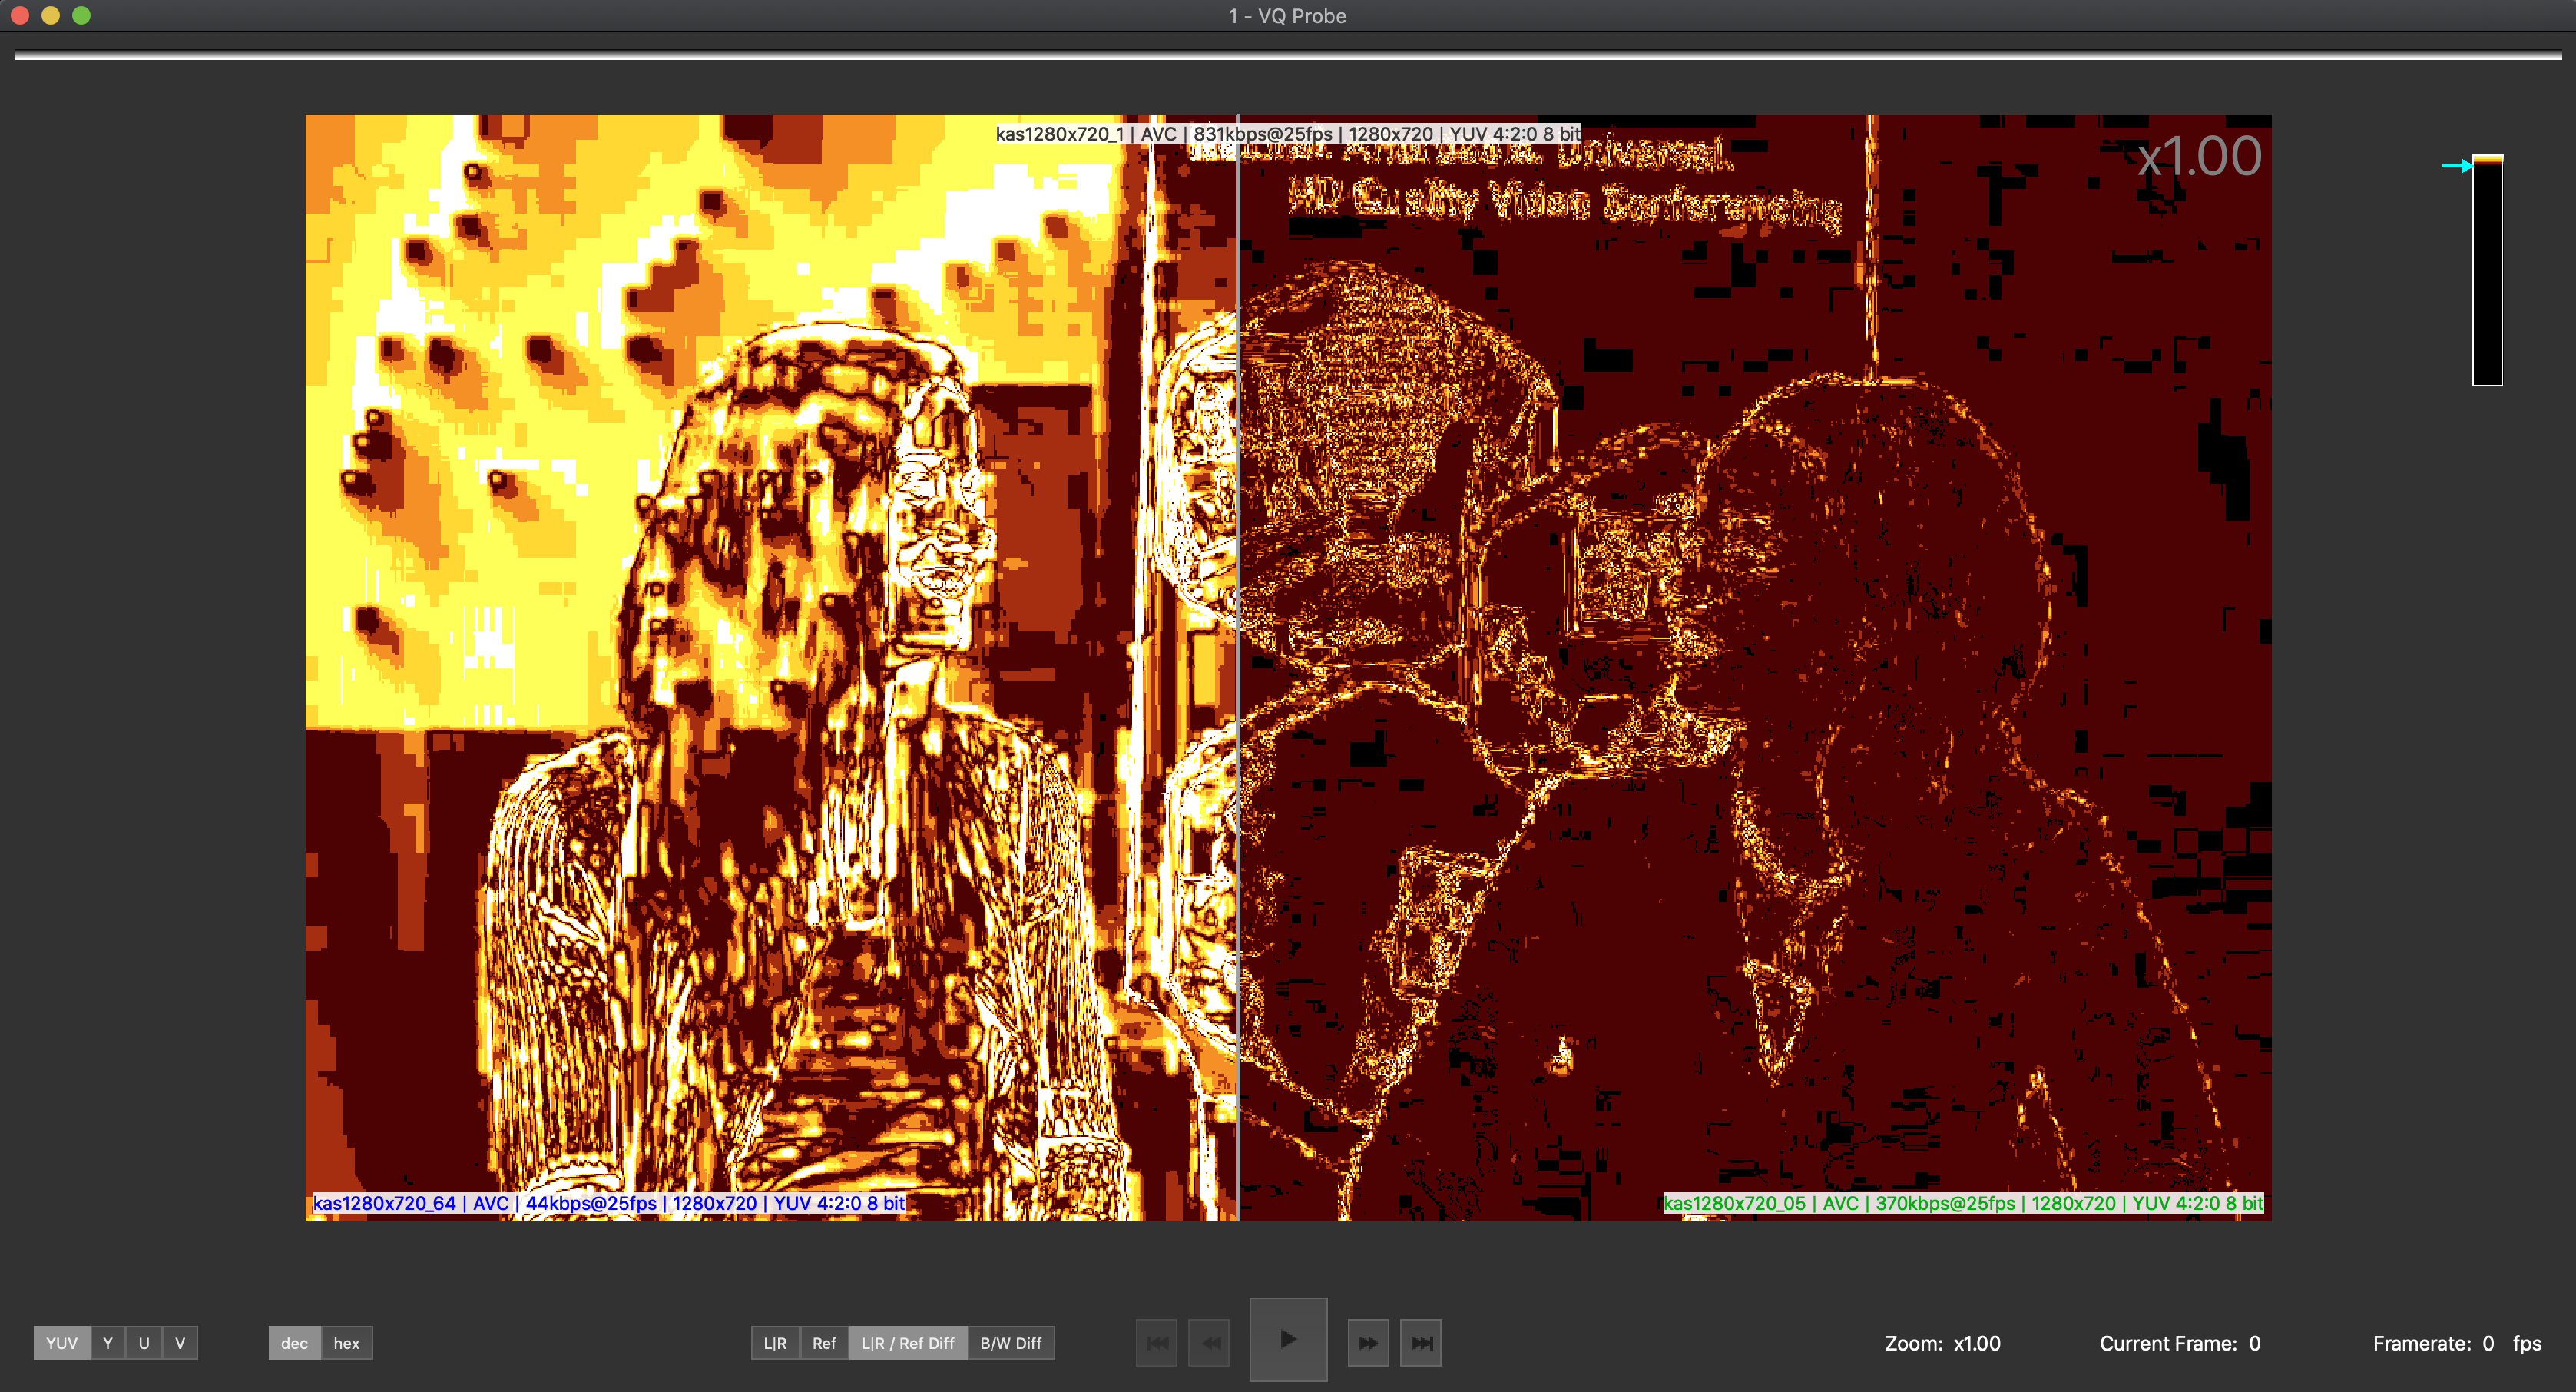
and quality metrics difference
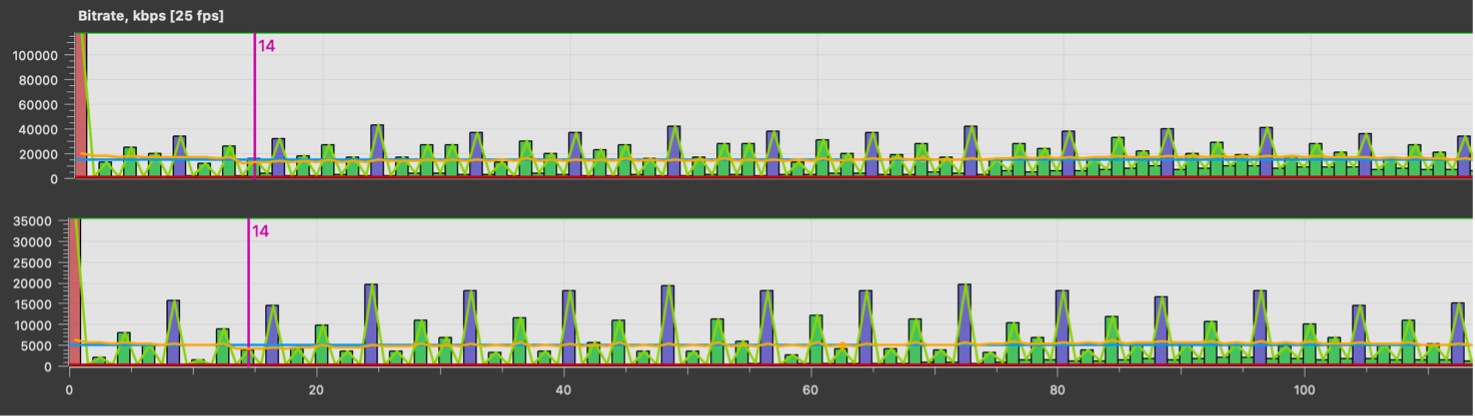
Buffer view
This is a double bar chart plotted with frame sizes. Each bar is colored according to the frame type. Move the mouse over a bar to get a tooltip with information about a frame represented by this bar.
Buffer View works synchronously for two streams.
Metrics in a Region of Interest (ROI)
Metrics calculation can be limited to a region. A region of interest (ROI) is a rectangle set for all streams in a project, which is used to calculate metrics
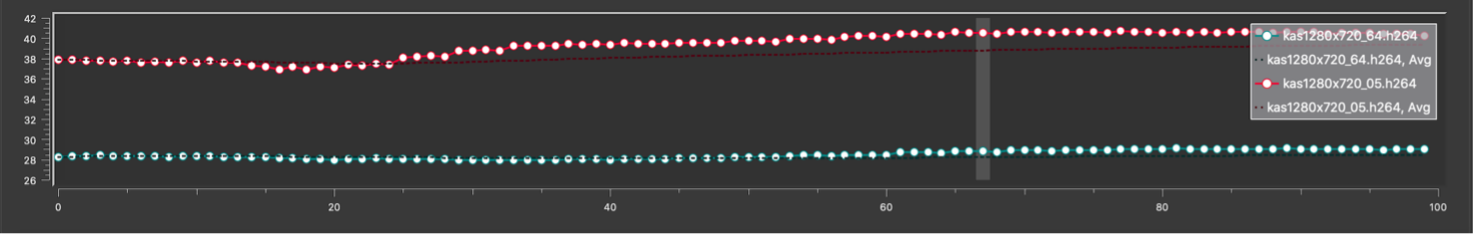
Convex Hull
A Convex Hull can be built for given RD curves to identify ladder switch points. Adaptive bitrate streaming optimization requires dynamic switching resolution for each title. This tool allows you to visually identify inflection points.
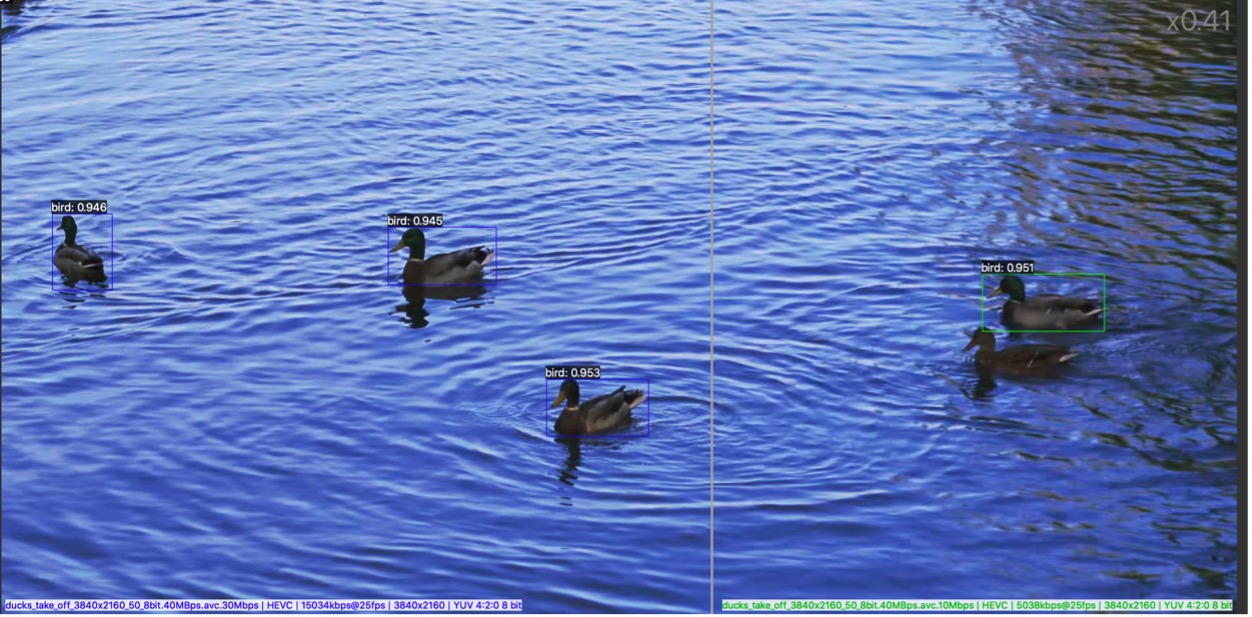
Object Detection
An Object Detection deep learning network can be executed to identify ROI. You can also compare frames of two streams by their object count.