Analytic tools – a new code coverage design makes a difference!

New Analytic tools version 7.0 is available now!
Innovations
New compiler for AV1 code coverage
The main reason for this update was the compiler's code coverage with maximum convenience in data extraction and informational content of the reports. As a result, Clang was chosen as the best option!
Rethinking the notion of the code region
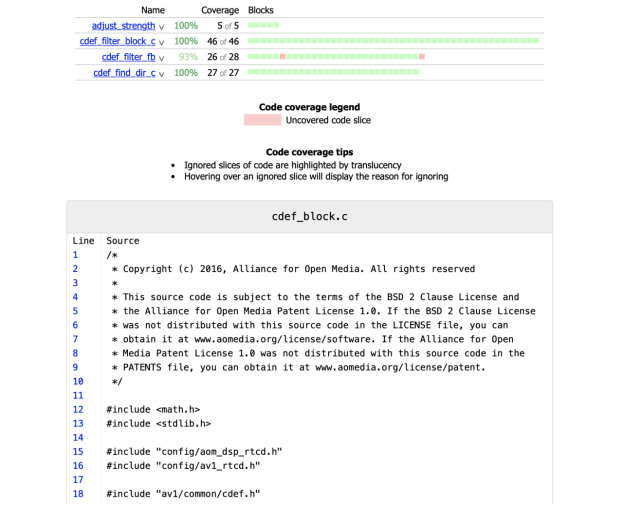
One of the main advantages of Clang: it “sees” code regions as a slice of symbols, not as a group of code rows as it was in the previous Analytic tool versions. This greater granularity makes code coverage reports far more detailed and allows observing every needed code section without blind spots.
Edges of a code region can be examined by hovering over a cell in the function summary section of the source code file report:

Uncovered regions highlighting
The primary purpose of the code coverage report was to show the percentage of coverage and make uncovered regions easy to spot. The second issue was achieved by highlighting uncovered regions anew, which makes uncovered code slices brightly red for greater visibility.
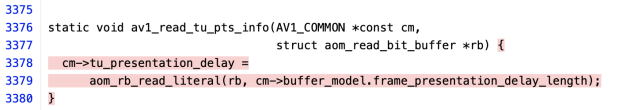
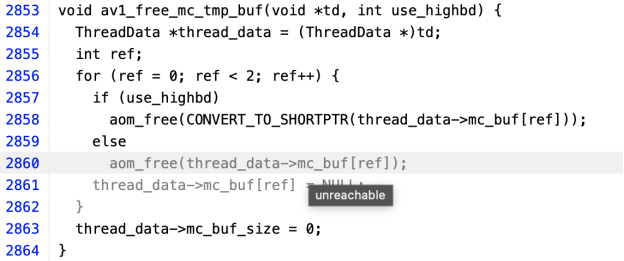
Ignored regions highlighting
It is evident that some code regions are unreachable for the routine program executions. It can be error handling or functions, the execution count of which is not interesting in case of code coverage. For such unneeded slices, highlighting of ignored regions was added using the translucency effect. The reason for ignoring can be observed by hovering over a translucent code section.
A new appearance of the source code section
We remade the entire design of the source code representation to focus the user’s attention on the coverage info only. Ignored regions are not conspicuous, while uncovered ones catch your eye!
Other features
Minor updates which are still worth looking at:
- --exclude-cc flag was added in the reporter to omit the code coverage section if needed
- optimizer lists processed streams in decreasing order of syntax coverage percentage
- --limit flag was added in optimizer to set the maximum number of sorted streams
Full changelog
Version 7.0
- Clang code coverage was implemented for av1 reports
- Source code reports design was rearranged to represent Clang code coverage data
Plans for the future releases
Nothing ever stands still, thus the Analytic tools won't either! In the future releases, we plan to implement VVC code coverage and Linux-based builds which can support it.
What are analytic tools?
The analytic tool is a proven device to analyze syntax and code coverage of video streams. It renders maximum flexibility and can be used with DVK streams and any customer streams as well.
The tools give a graphical representation of syntax coverages, speed up test cycles by reducing the streams and their number, compare the stream coverage.
How to obtain them?
You may use the latest version of analytic tools by purchasing DVK or contact us to get analytic tools only!