Automated API testing

We are currently developing a web application to compare the quality of video codecs. As the number of features increased during development, we understood that manually testing the application's functionality was becoming unreasonably tricky and time-consuming. Unit tests also do not allow us to thoroughly test the application in a quasi-production environment. We decided to implement an automated testing system for our web application. The main goals and motivations for creating this system are:
- to increase the speed of the application's validation so that improvements and new features are delivered to the end user faster;
- to speed up errors detection and localization and, consequently, their correction;
- to add another step to the development cycle, which will ensure that the user will get a functioning application.
Usually, autotests are divided into two types: UI tests and API tests. In this article, we'll describe how we create and use autotests to check the health of our application's API.
What we use for autotesting
We use python 3.10 to implement the autotests because it is our application's backend, making it much easier to support the tests. We also use the Pytest framework, considered the de facto standard for python test programs. We use MongoDB as the database. To run the tests, we bring up a mock database, a fake application used for testing not to affect the main database. Allure (developed by Yandex) is used to create reports with a graphical user interface because, by default, pytest provides only a text report, which is very inconvenient with a large number of tests. We use Allure because it integrates with Pytest and is the most popular among autotest developers.
Creating a test infrastructure
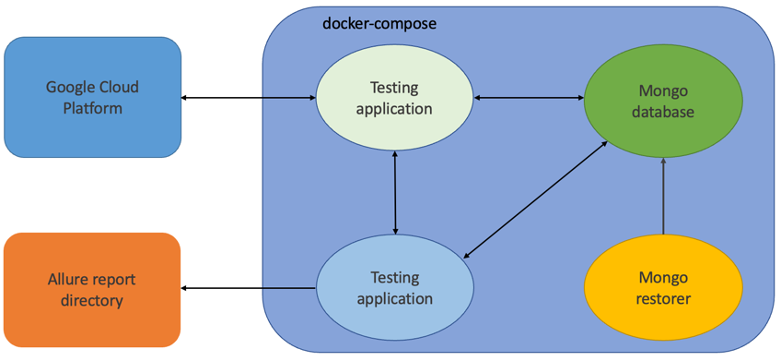
To execute tests, it is necessary to organize a test environment to ensure the entire operation of the tested application in normal mode. For our application to be fully functional, it must have access to the database and the Google Cloud ecosystem.
To deploy the test infrastructure, it was decided to use docker compose because you can raise all the necessary applications with one command. In addition, it is possible to use the undoubted advantage of containerization - a "clean" environment. You can be sure that no other running process will be able to disturb the application. Another undeniable advantage is the possibility of creating an internal network through which containers can exchange data. Last but not least, we use Docker containers to deploy our application.
Two containers are used to bring up the database. The first uses a mongo image from the open-source docker repository. This container is a database application. Unfortunately, due to the specifics of running mongo on virtual machines, it's not possible to just copy the data files and use them in work. A second container is created where the database dump is located to solve this problem. Using the «mongorestore» utility, this container restores data to an already raised database. After these manipulations, the database is completely ready to work.
The docker image of the testable application is based on the python: 3.10 image. The necessary python requirements, docker, and ClamAV antivirus are pre-installed in it. The application code is transferred using volumes when docker-compose starts. Environment variables (containing database credentials, names of images used in Google Compute Engine) are set in docker-compose.yaml.
So again, the testing application's docker image is based on the python: 3.10 image. The necessary python requirements and the report generation tool, allure, have been added to it.
Creating an authorized user session
In our application, quite a few editable (deletable) entities (sessions, tests, codecs, media files, etc.) are assigned to specific users. Only their owners (creators) have access to these entities to protect them from the influence of third parties. To test the API, we need to simulate requests from an authorized user.
To do this, a fixture is implemented - a function that runs before or after the test, available for any test in a specific scope: function, class, module, or session:
@pytest.fixture(scope='session')
def vq_client():
  yield VQClient(APP_HOST, APP_PORT)
This simple fixture returns an object of the VQClient class. The constructor of this class takes four parameters: application host and port (mandatory), user name and password (optional). If the last two parameters are not specified, the user will be created automatically (added to the database). Next, a working session is created using the requests library (self.session = requests.Session()). After that, an authorization request is sent. From this point on, all requests sent using the «self.session» object are sent on behalf of the authorized user.
Implementation of the tests
We have divided the tests into different modules according to the entities that the API works with. Each module has two classes: with positive and negative tests. Positive tests are the tests where we expect the request to succeed, and negative tests are the tests where we expect the program to report an error, such as «Unauthorized».
When using the Pytest framework, you need to be careful with naming. For the parser to be able to find tests, the name of each module containing tests must start with "test_", class names must begin with "Test", and the test names must start with «test_".
Each test consists of three stages: preparing for the test (creating an entity), sending a request, and checking the result. For example, consider the request test, with which you can change the public status of the uploaded codec. The first step is creating a database record with the necessary fields: codec identifier, owner identifier, and public status. Next, send a request to "/api/bin/update_public_status", add to the body of the request the codec identifier and the public status opposite to what was recorded during creation. In the last step, using the "assert" operator, we check that we received a success message with code 200 in response to the request, and then we check in the database that the public status has been reversed.
It should also be mentioned that all data written to the database when creating users, codecs, and other entities are generated using the Faker library, which can produce a variety of data on different areas of knowledge. In addition, this library has support for different localizations.
Running tests, report generation
The test environment is started with the commands:
docker-compose build
docker-compose up --abort-on-container-exit
With the --abort-on-container-exit flag, we start docker-compose so that if at least one container has stopped, all others will also stop. This is necessary so that the database and the application will stop working when the tests are completed.
The container of the tests is started with the command:
pytest -s -l -vv -n 4 /root/tests --alluredir=/alluredirThe -l flag allows local variables to be displayed in error messages. The -s flag is a shortcut for-capture=no; that is, we enable the output to be displayed from the print() function. The -vv flag shows the level of verbosity. /root/tests is the directory where the tests are located. With the -n 4 parameter, you can run tests in 4 threads, and with --alluredir, you can specify the directory for generating the Allure data.
To generate the allure report, we use the command:
allure generate -c /alluredir -o /allure-reportThe -c parameter indicates the directory with the data generated by pytest. The -o parameter indicates the directory in which the report is to be saved.
Allure is a visual interface for reviewing test results. It supports several languages. Allure generates a detailed report that allows you to sort tests by status, suites, packages, and functionality. There are many graphs and trends to separate tests by run time and severity and observe changes in the overall test results. In addition, the allure can integrate with pytest, which allows you to divide tests into individual steps and add help information to the test (text, files, screenshots, etc.) for a detailed demonstration of what happens during the test.
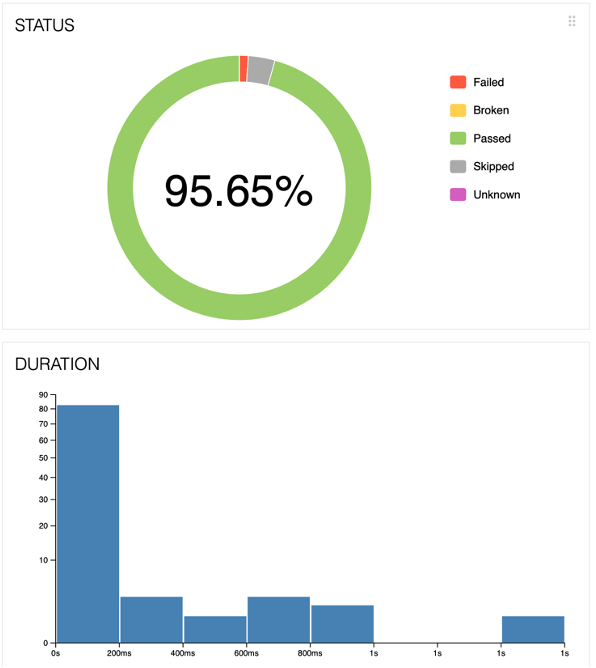
This image shows a summary diagram of the test results. The value of 95.65% shows the proportion of tests that were completed successfully. The remaining tests may have the following statuses: "Failed" - an error in the application under test; "Broken" - an error in the test code; "Skipped" - the test was not executed in this session; "Unknown" - an error in the test writing (the test was not conducted). Also presented is a bar graph showing the distribution of tests by execution time. The diagram indicates that most of the tests (more than 80) were executed in less than 200 ms.
The following image shows the report of the test session. On the left, you can see the list of tests, divided into groups. Opposite the name of each group, you can see a summary of the success of the tests in that group. Next to the test name, you can see an icon indicating the test result and the test completion time.
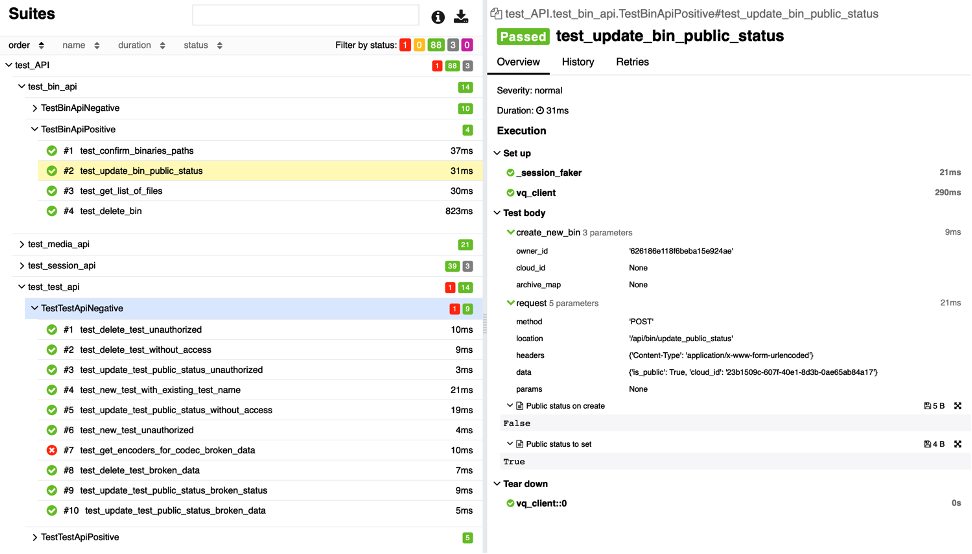
A detailed report of a particular test is displayed on the right. You can see the procedures performed before (Set up) and after (Tear down) the test. In the test body section, you can see detailed information about the steps performed during the test (create_new_bin and send request) and the attached files (Public status on create).
Conclusion
We've now added a mandatory testing phase to our Gitlab CI pipeline. This allows us to ensure the application works correctly, detects and fixes bugs faster, and, most importantly, saves time for checking the application's health.