Codecwar.com introduction


Abstract
I’ve been working in the video compression field in various roles for more than ten years and was always eager to have proper tools to test video codecs in various aspects and get results that are meaningful and render proper insights. Here are some examples:
As a codec developer, I need to validate new encoding algorithms or coding tool optimization to check if it produces any benefit.
As a manager, I’d like to understand if the engineering team is working toward a goal and meets the landing zone requirements. As well as it prepares accountable, visually presentable data for higher management and marketing team.
As a consultant, I help customers to improve their video pipeline. This includes the selection of a proper software stack as well it’s fine-tuning so that the customer can provide the best user experience to its clients.
All these usage scenarios include the execution of video codecs under various configurations on various video streams and quality metrics calculation, building RD-curves, and calculation of BD-rate metrics.
In this article, I’d like to present a tool for such video codec quality evaluations, where we wanted to achieve two main tasks:
- Be user-friendly for non-experts in video compression.
- Provide fine-tuning mechanisms of codec execution for specialists.
A brief history
All such tools usually start as a simple script to automate the execution of standard encoding -> decoding -> quality metrics pipelines. This script became more and more complex over time, providing more usage scenarios and flexibility. We as well have one which started from a simple bash script and evolved into a complex python-written tool that provides nice excel sheets.
As the amount of historical data and users grew standalone usage became bigger, so disturbance because of unified data storage with web access has been introduced.
Targeting our codec team as well as the non-expert’s system evolved, so at one point, we decided to share it with the community. That is how it was born. And after several months of extensive development, we are proud to release it finally!
General overview
Codecwar could be described as a set of services, the major of which are:
- Compare – a service to build comparative codec quality reports based on available data.
- Create – a service to run your sessions with custom pipelines to be used in reports.

And several auxiliary services to provide a better user experience:
- Learn – a set of small handy services in the area of video compression, like a handy BD-rate calculator for quick data analysis.
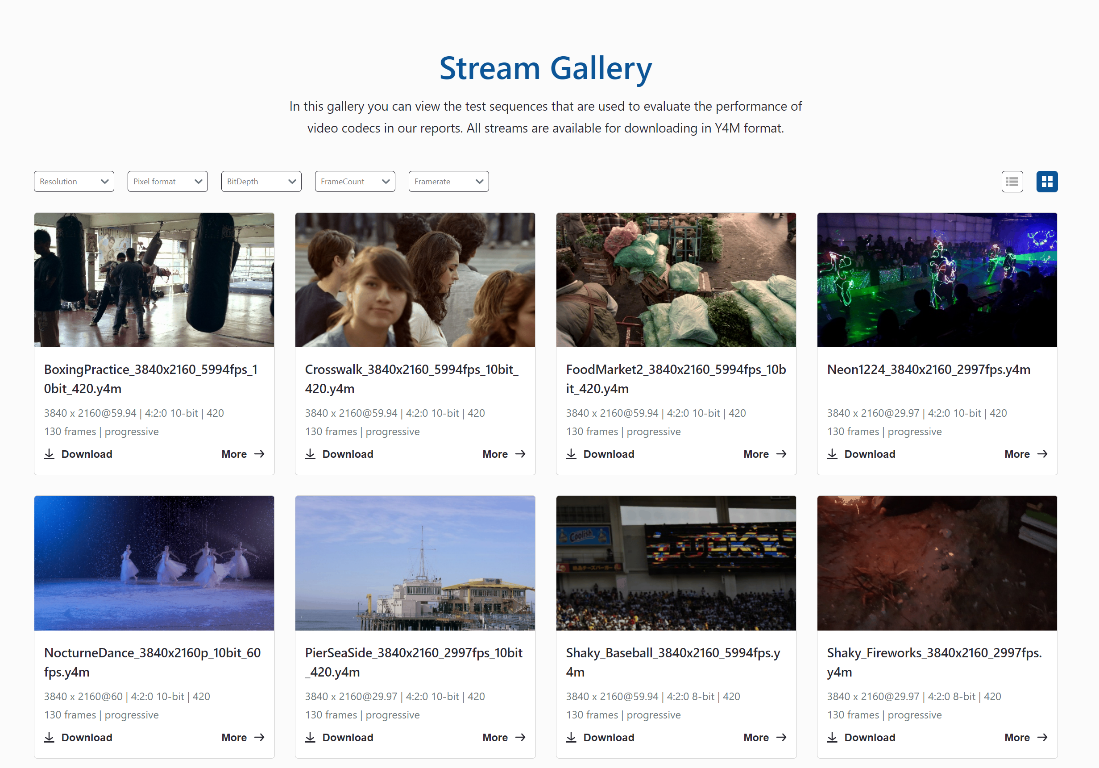
- Media gallery – a gallery of video streams with their characteristics that are available to run pipelines on.
- Dashboard/Workspace – an entry point and a panel to control running and finished sessions.
Tech info on available entities:
Encoder implementations:
- HPM (AVS3),
- JM (AVC),
- HM (HEVC),
- VTM (VVC),
- libaom(AV1),
- AVM(post-av1 research)
Decoder implementations: as encoder one as well as FFmpeg
Streams: AOM CTC v3 streams.
Metrics: libvmaf supported metrics: PSNR, PSNR-HVS, SSIM, MS-SSIM, VMAF, VMAF-NEG, CIEDE2000
Quality only evaluation: encoder -> decoder -> metrics. No pre/post-processing.
Plots: RD curves with BR-rate calculations.
Let’s take a closer look at some of the services:
Compare
This service allows us to build comparative quality reports. You could immediately try it to get answers to questions like which VVC or AVS3 is better. How much better is AV1 than AVC? This part of the service is fully free to use, and we already gather plenty of data on reference implementations of various video compression standards.
Here is a quick guide:
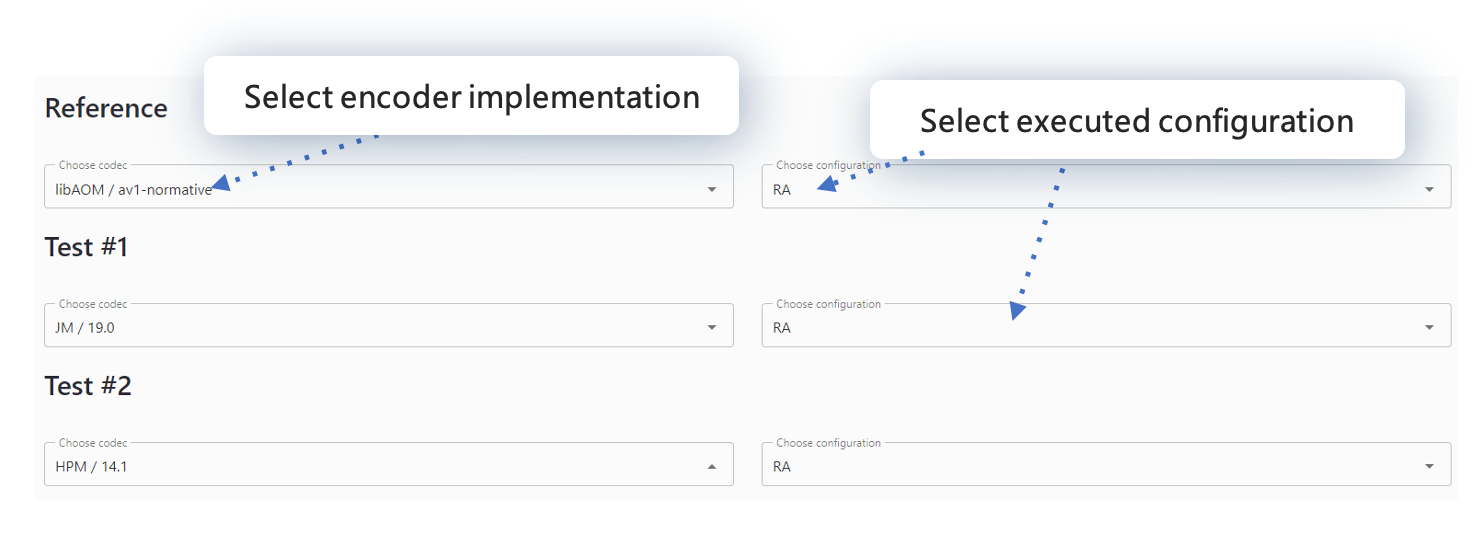
1. Open the service and select which codecs implementation to compare with each other. One of them will be a reference as we get relative quality performance results. We have data on all major reference models on their CTCs (common test conditions) random access and low delay profiles. All data were collected on the AOM CTC stream data set.
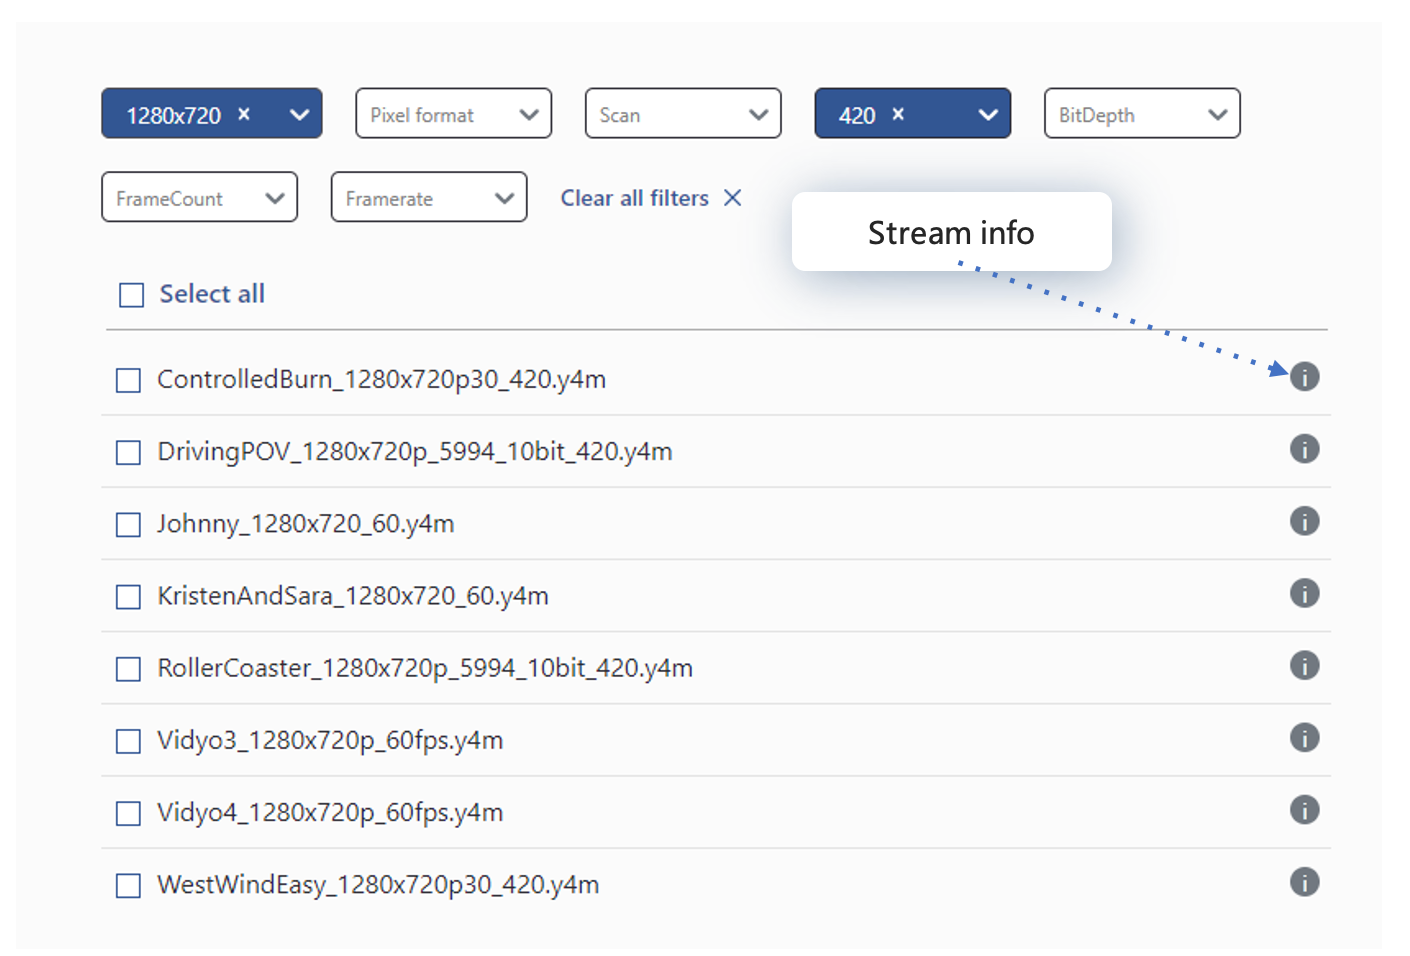
2. Select streams for which the results should be provided. Filter by resolution, bit depth, and so on, or just select them all. Press build, and that is it!
How to read a report?
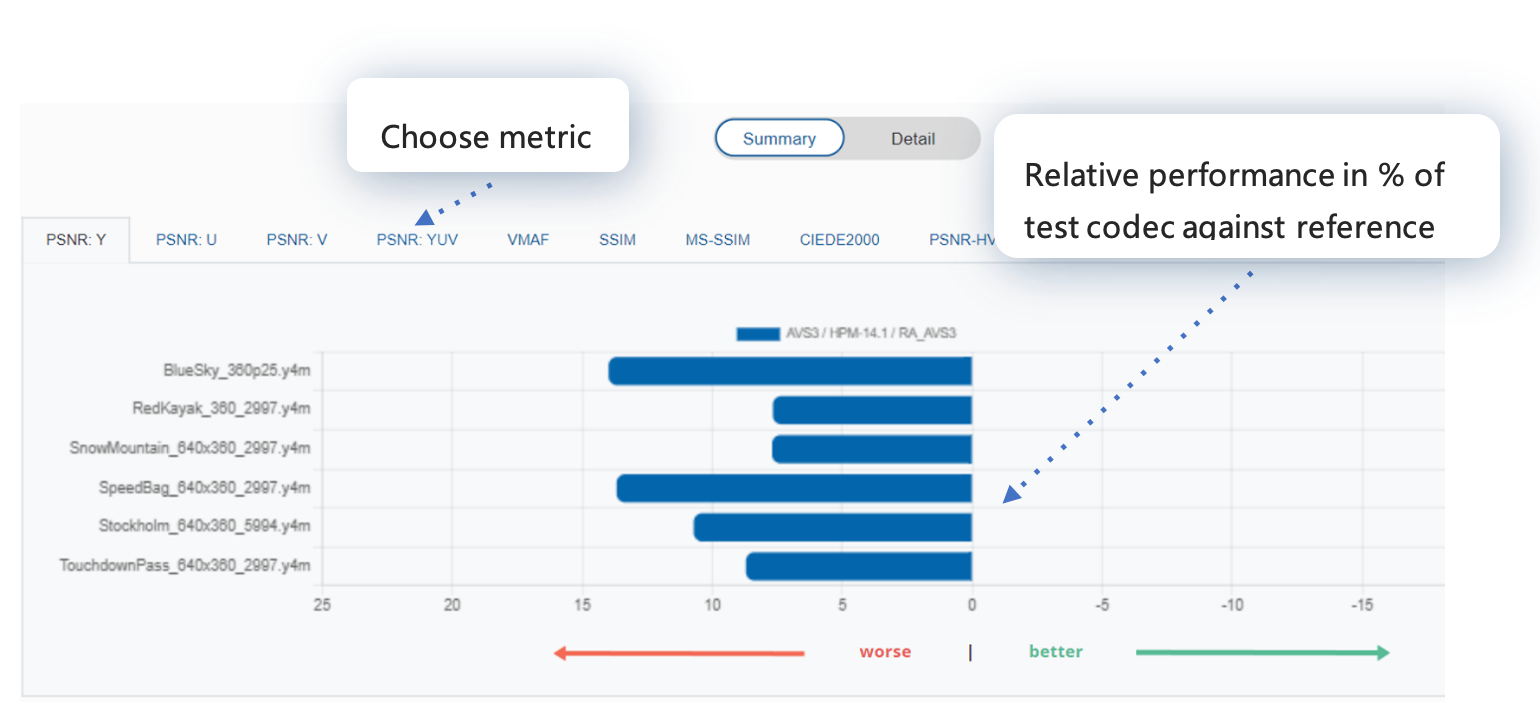
It consists of two main pages: a summary to get a general idea about codec performance and the details to get RD-curve for each stream.
How to read the summary page:
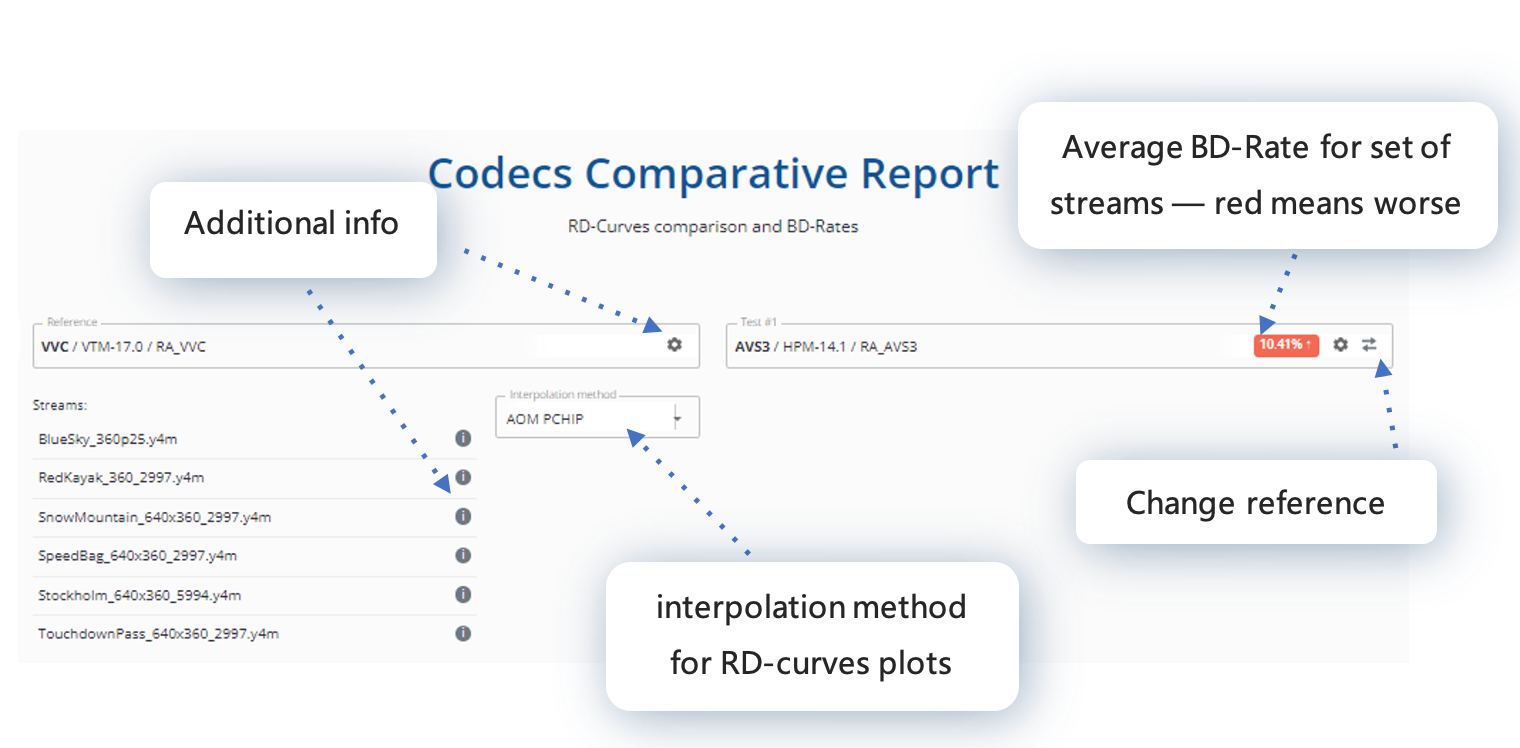
How to read the details report header:
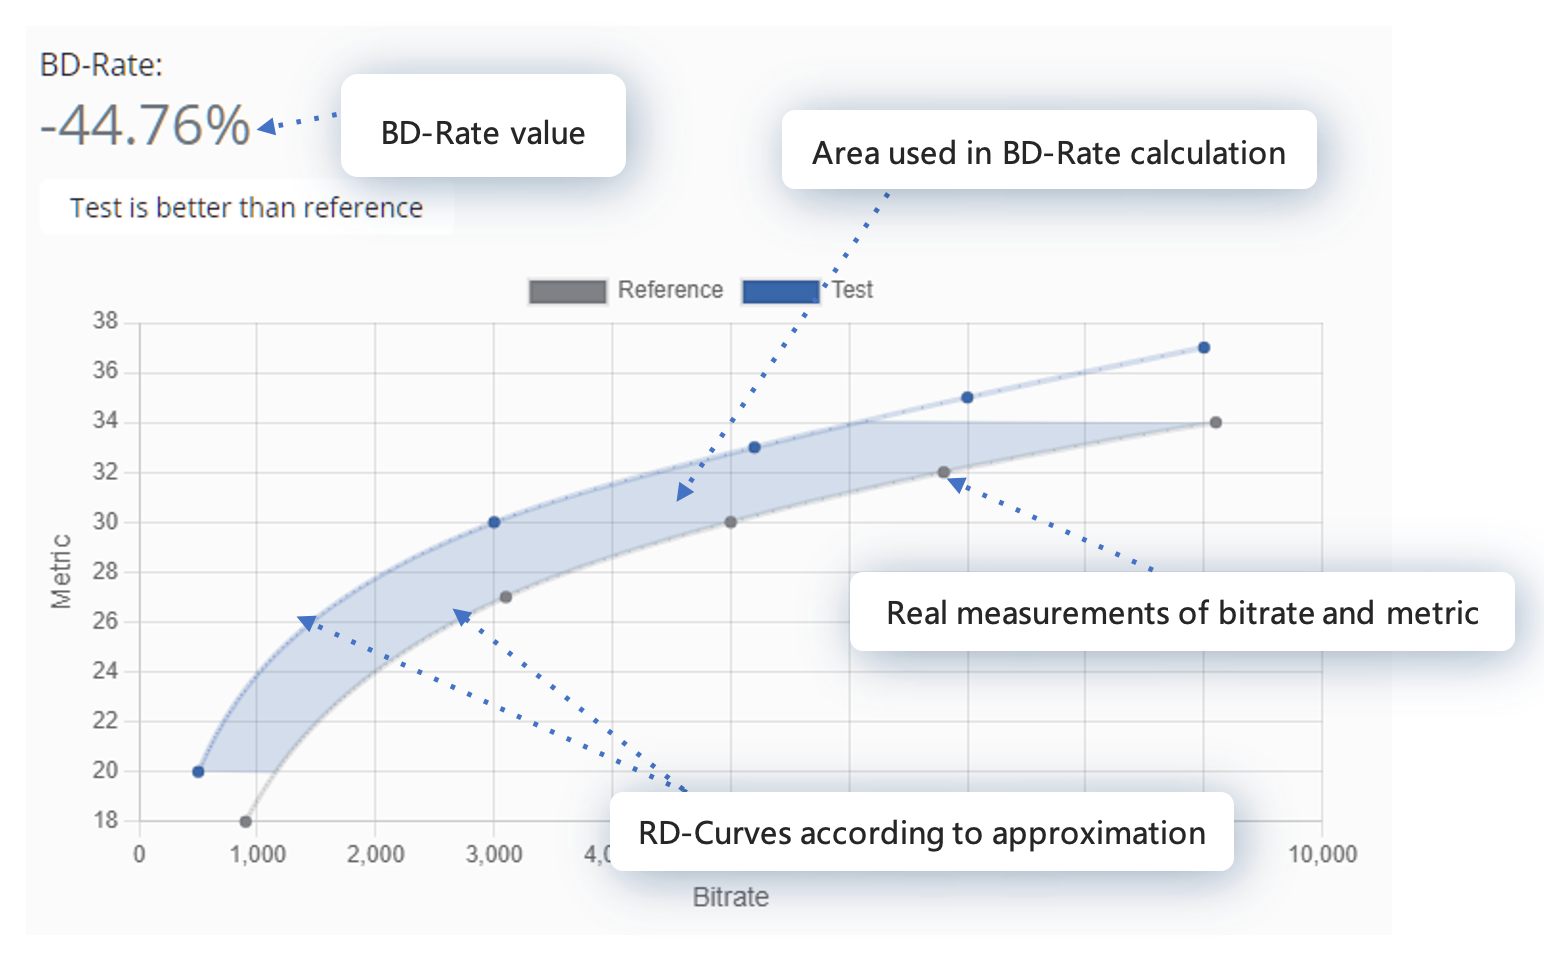
How to read each plot data:
Create
is the leading service for creating custom data for research or performance evaluation. Let me guide you through the steps needed.
1. Select codec implementation binary. The selection is restricted, but more is to come.
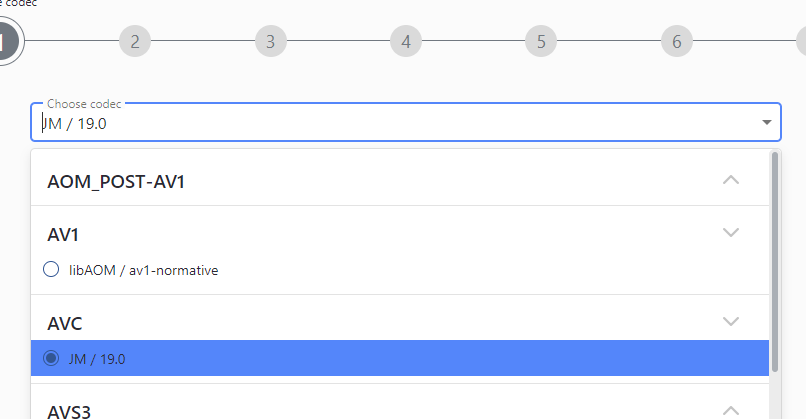
2. Configure binary, use predefined configuration as a template to create from scratch.
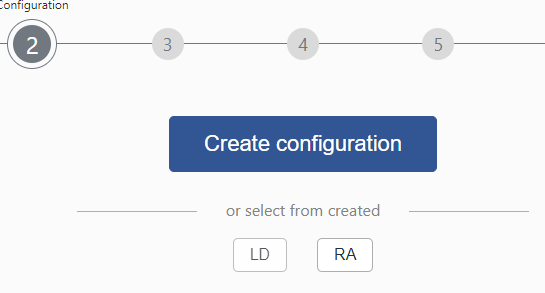
The creation of a new configuration could be a tricky process, so it's highly advisable to test it first locally.
First, select the type of the output stream: raw or compressed. In the latter, decoding using VQProbe will be done. Please refer to its documentation about what codecs are used.
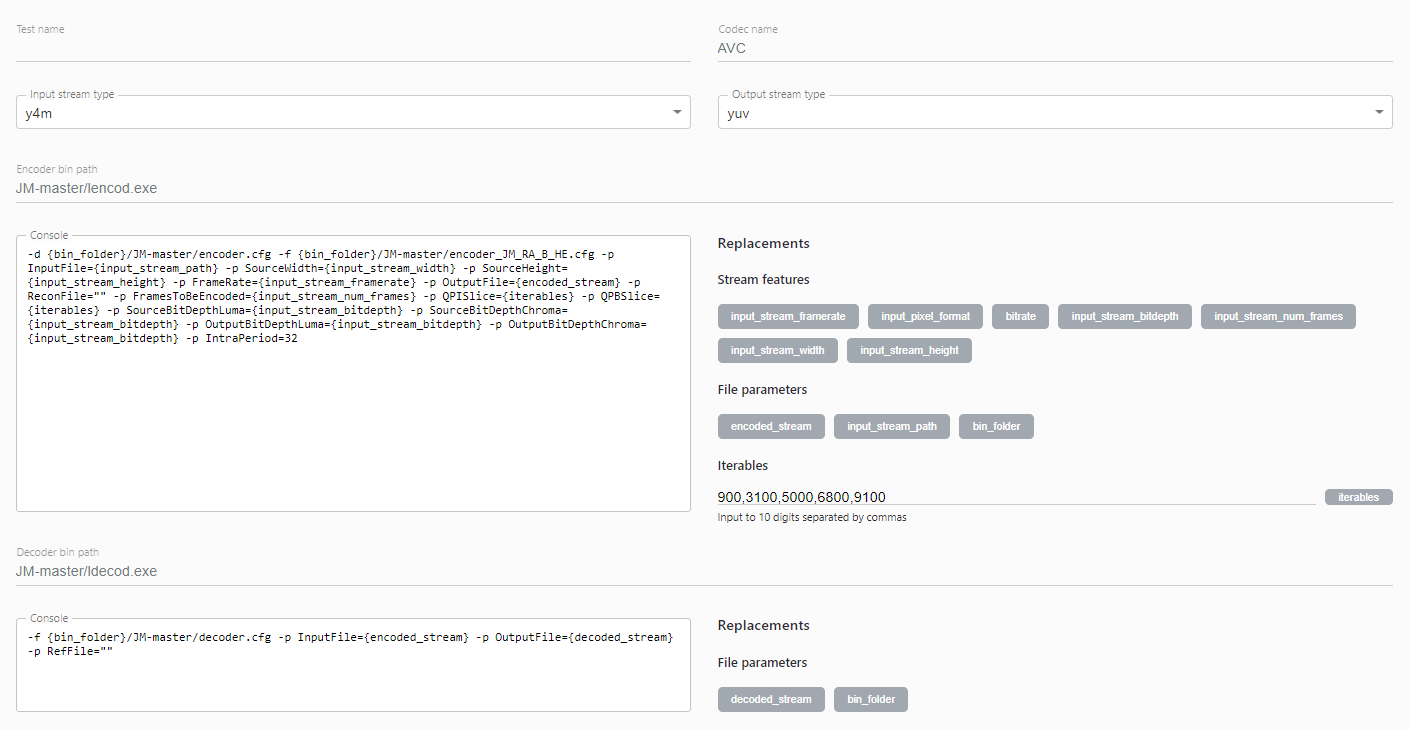
Then fill encoding parameters. You could set RA (random access) or LD (low delay) configs as a template. We prepared them based on the appropriate codec binary CTC document. Some of them are fixed: stream information is substituted automatically as well as the input/output file information.
And finally, set the decoder options; default values should be just fine.
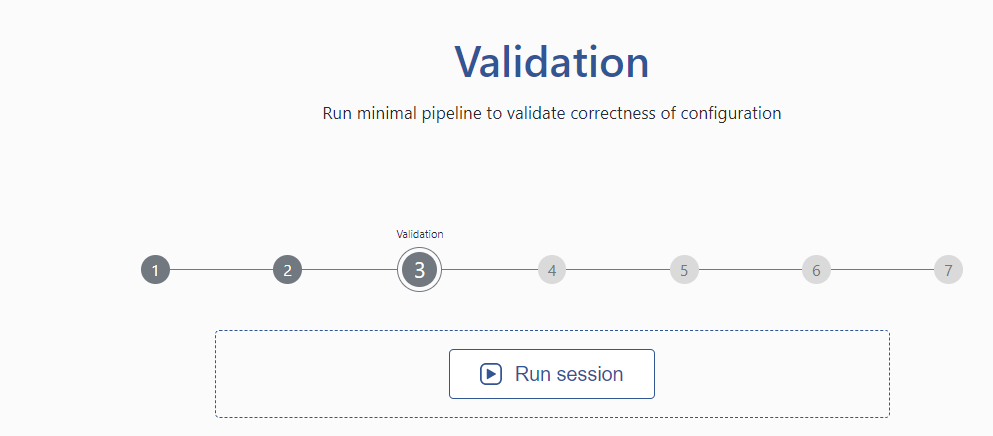
3. Run a sanity check test – it’s a rapid and small validation to check that configuration makes sense. Created configurations can be found on the Personal Account page.
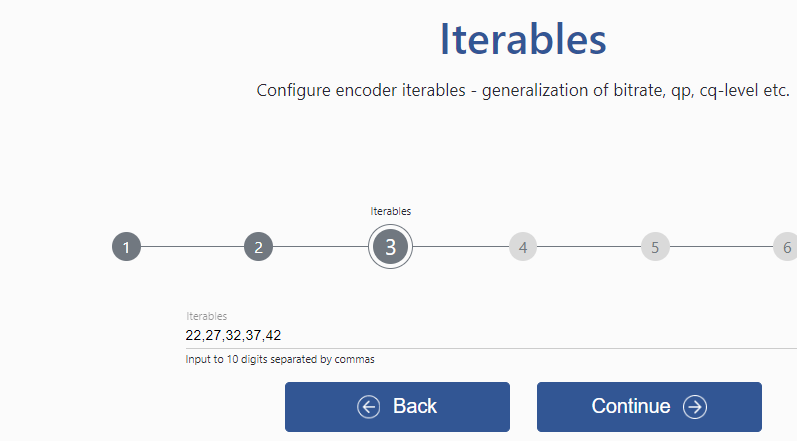
Select iterable parameters – this is the main option where each value will be used to build an RD curve. In our case, it is a comma-separated number that substitutes the quantization parameter in the encoder command line template. The parameter can be set when creating a configuration or when modifying the existing configuration.
4. Select streams to run either prepared stream pack or separate streams.
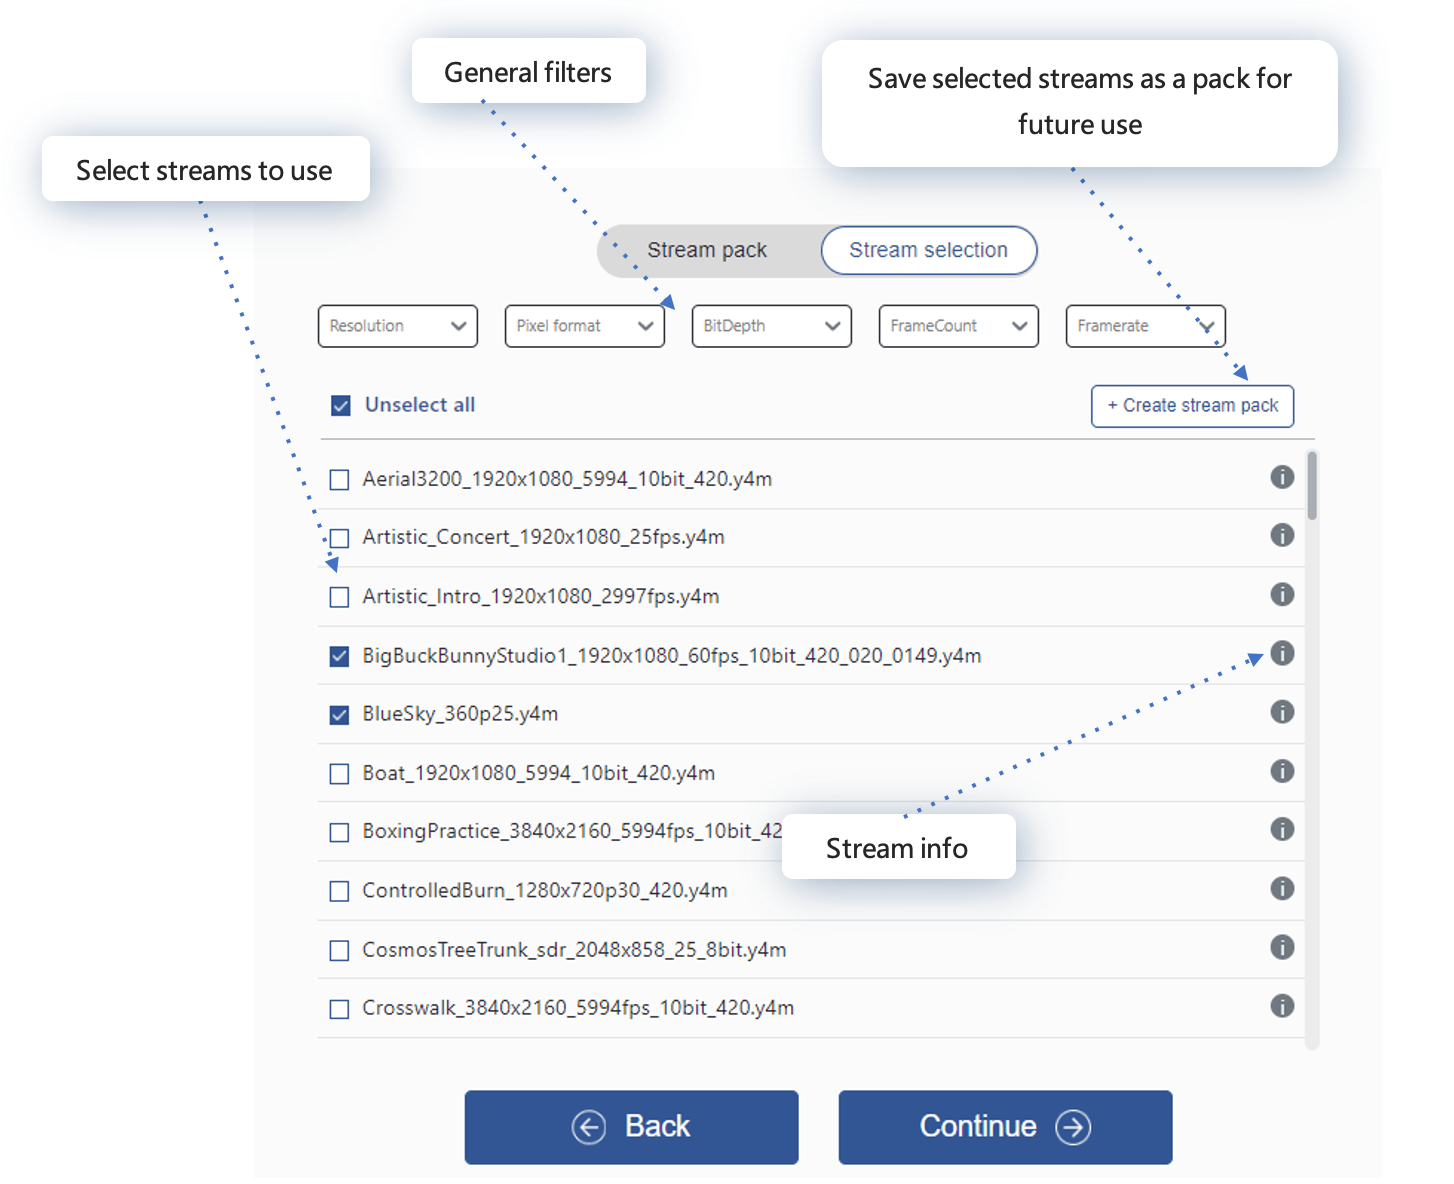
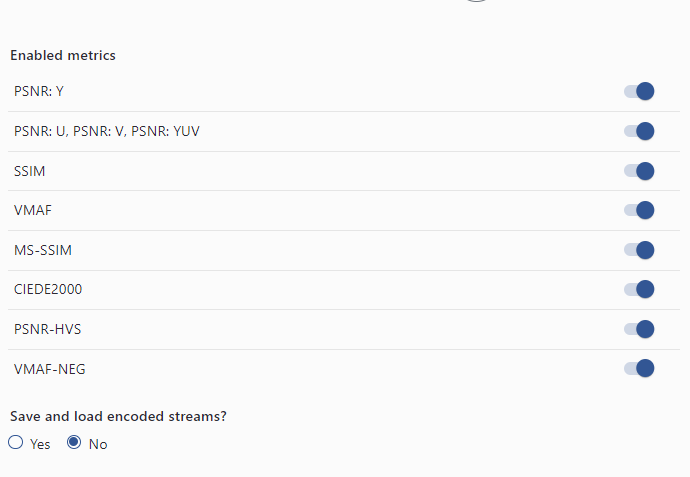
5. Select quality metrics in which you are interested and miscellaneous parameters: memory leak checks, and hang-up timeout.
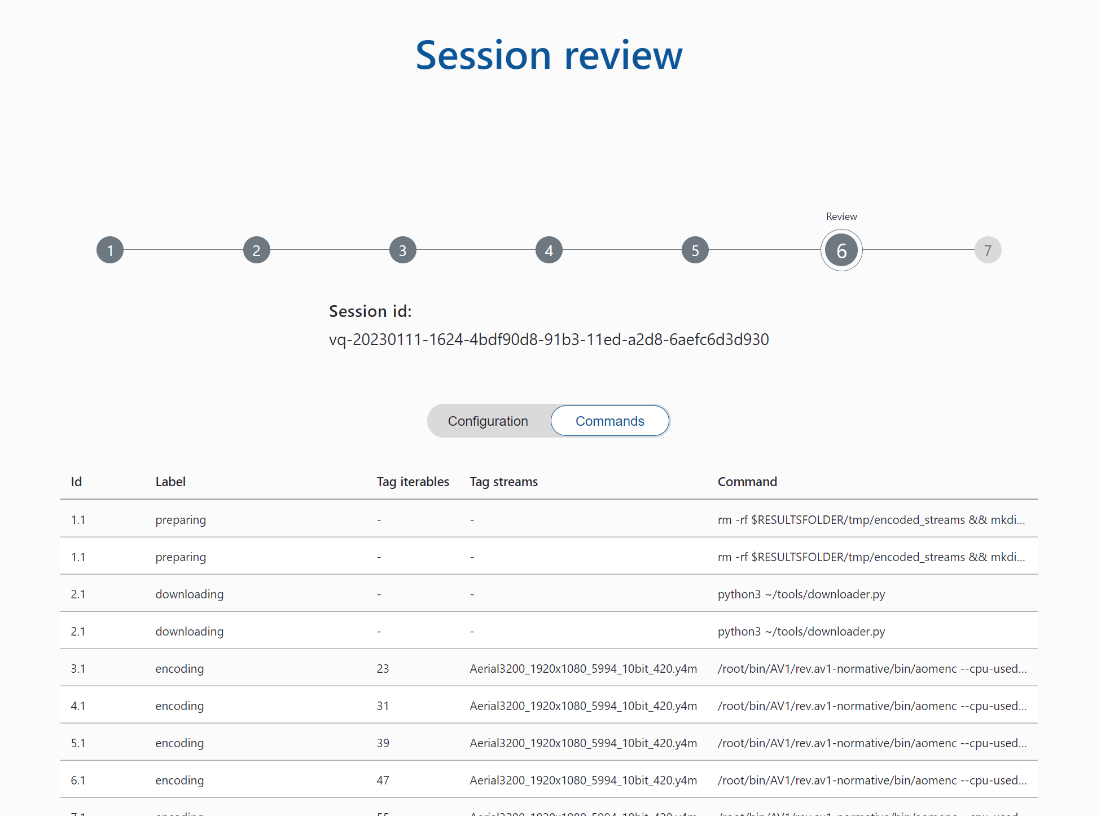
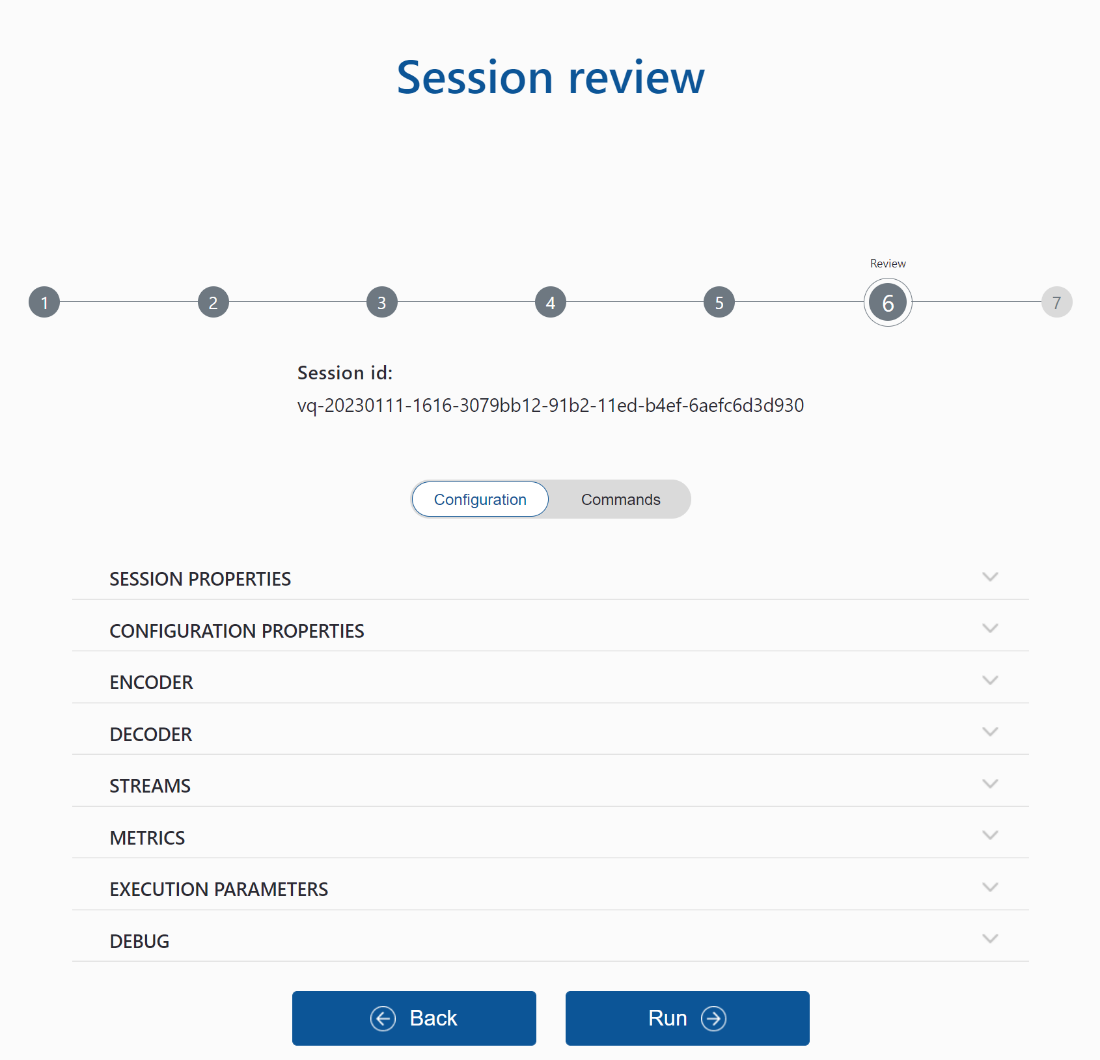
6. Review session. The “Configuration” tab shows all parameters selected in the previous step and “Commands” – all commands that will be executed. It could be used as is to reproduce the behavior locally. If everything is correct – just run it!
A newly executed session will be available on the workspace page – so let’s look at it.
Workspace
A lot of sessions like that could be executed, and many were actually; to navigate and control all such things, we prepared a special dashboard called the workspace. It's a grouped list of all executed and in-progress sessions, private and shared with your account.
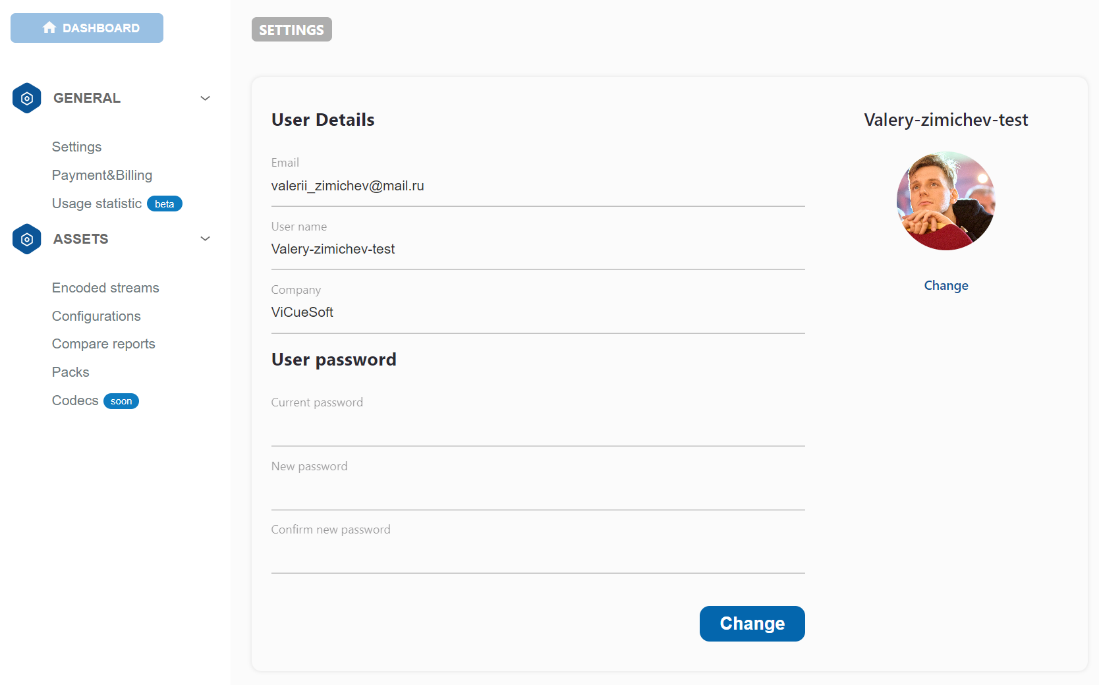
Personal account page

Clicking on the Profile button takes you to your Personal page. Here you can change your username, avatar, and company name; view and replenish your internal currency balance; and manage your assets on the site - all your created configurations and packs are already here. You can recreate, rename, and perform other actions on your personal profile.
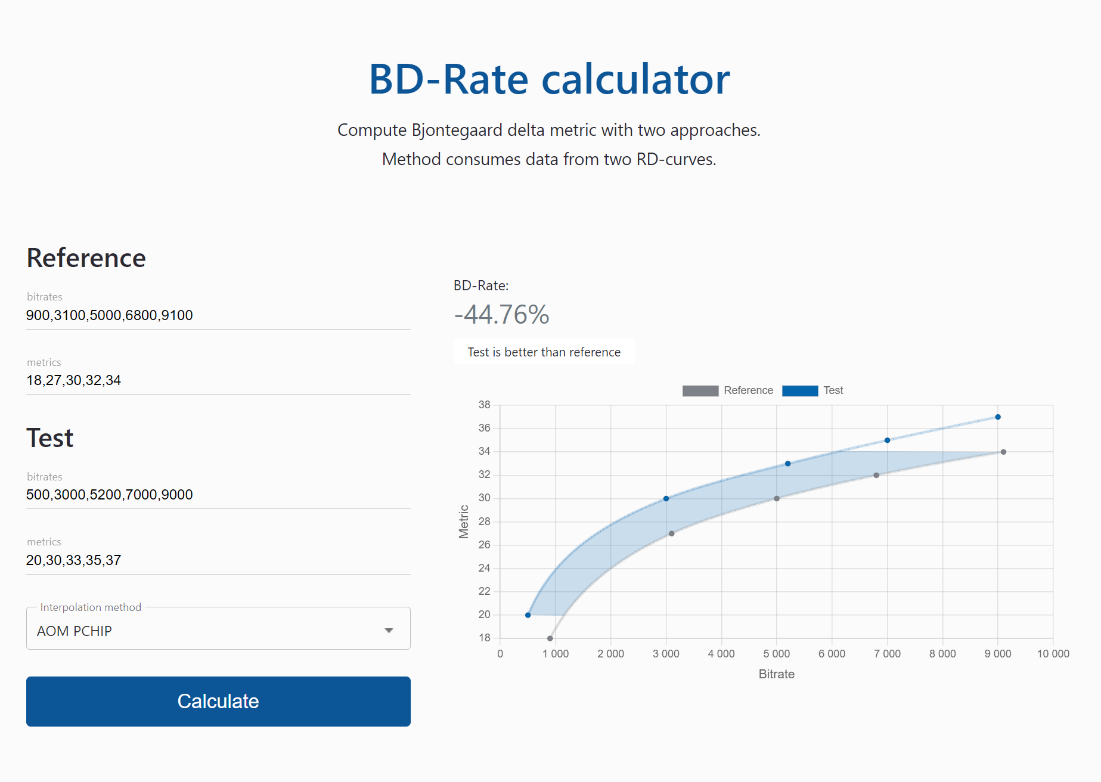
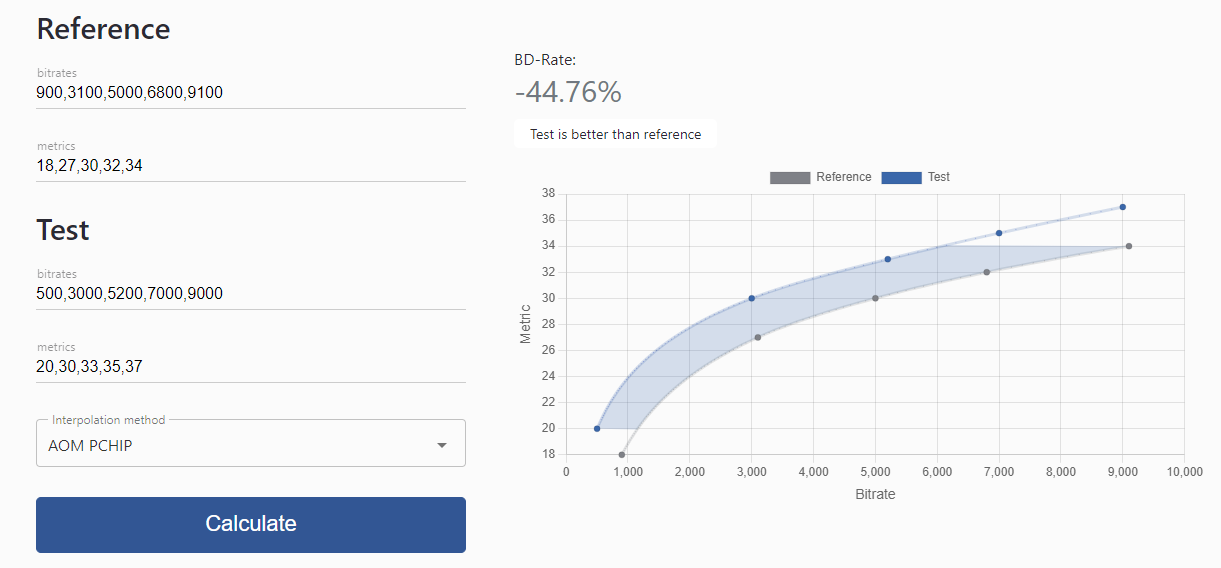
RD calculator
This is a tiny calculator for educational and quick check proposals. How to use it - Insert values in the field and press calculate.
You can test it yourself at the official CodecWar website. This ends our tour around the service, I hope it’ll be helpful to dive deeper into the modern video compression landscape. As it might not mean much to do, the service is being actively developed; therefore, more exciting features are to come! Thanks for your time.