How to make encoder developer daily work easier?

In the article below, I'll walk through which tools could be used in the daily codec engineer activity. One of them is VQ Probe. It allows to provide one the best of its kind visual quality assessment of video streams, and get insights of local problems in video frames as well as the general visual quality over the scene. But it has not only GUI mode, but also a CLI one.
Let’s imagine one of the possible use cases:
You are working with an implementation A in an effort to make video compression more efficient and trying various techniques and doing experiments.
The typical work cycle is:
1. Think about a new encoding technique or an enhancement to the existing one.
2. Perform an experiment.
3. Check if it actually works and compresses more efficiently:
- Run tests on a dataset that represents various types of content;
- Analyze the results.
4. Repeat until you get a satisfactory result.
One of the significant and mandatory steps p.3 is running an experiment on a data set and the result analysis. This is a critical, machine resource-consuming, but an automation-friendly step. And that is where VQ Probe could be your pal.
Now let’s walk through a possible user pipeline. For simplification, our exact use case is as follows.
Metrics to analyze – PSNR-Y, SSIM, VMAF.
Implementation A is a reference or a “gold” algorithm.
There is an experimental implementation B – our study algorithm.
Encoded streams are compliant with a standard supported by VQ Probe. If it is something entirely new, you'll need to add a decoding step to your implementation and provide raw video to a tool.
Using VQProbeConsole, we will try to automate the validation cycle step.
Below is a script that creates two projects: 720p stream and 4K stream with 4 points as a reference RD-curve (“gold algorithm”) and 4 points for a new algorithm.
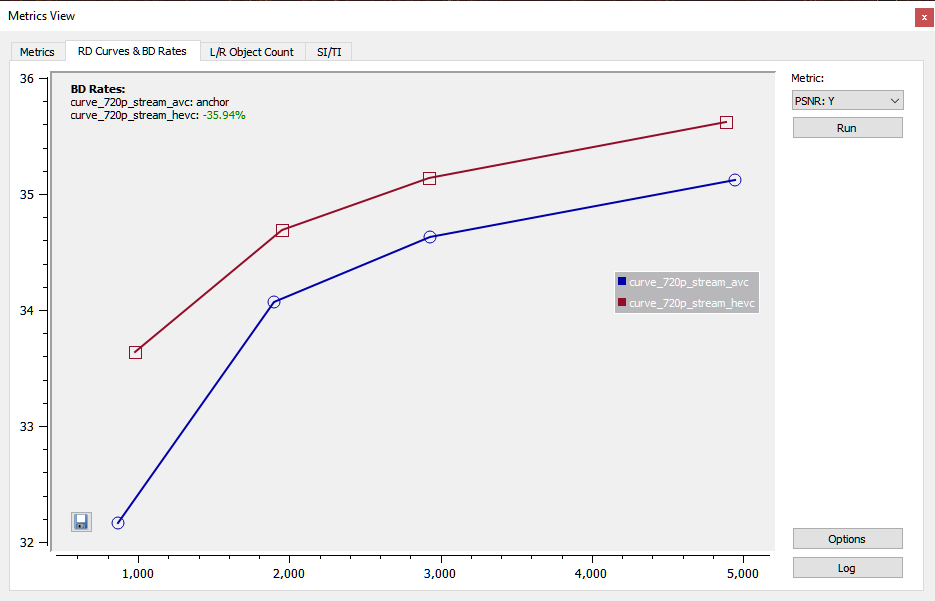
As a result, two output json files will be generated for each stream with per-frame values of quality metrics and BD-rate values for two projects.
The script is provided for Windows platform, but could be easily adapted both for OS X and Linux-family systems.
The script is executed from a directory where encoded or decoded streams are located.
set bin="D:\VQProbeConsole.exe"
set results_dir=metrics_cache

rem Calc metrics for 720p stream
set proj=720p_stream
%bin% --create %proj% -y

rem set ref https://media.xiph.org/video/derf/y4m/720p5994_stockholm_ter.y4m
%bin% -p %proj%.vqprb -a D:\streams\720p5994_stockholm_ter.y4m -t ref

rem curve avc aka old algorithm
%bin% -p %proj%.vqprb -a 720p*.h264 -t curve_%proj%_avc

rem curve hevc aka new algorithm
%bin% -p %proj%.vqprb -a 720p*.h265 -t curve_%proj%_hevc

rem calc metrics & bd-rate
%bin% -p %proj%.vqprb -d %results_dir% --set-anchor curve_%proj%_avc --enable-psnr-y –enable-ssim –enable-vmaf

rem Calc metrics for 4k stream
set proj=4k_stream
%bin% --create %proj% -y

rem set ref https://media.xiph.org/video/derf/y4m/park_joy_2160p50.y4m
%bin% -p %proj%.vqprb -a D:\streams\park_joy_2160p50.y4m -t ref

rem curve avc aka old algorithm
%bin% -p %proj%.vqprb -a 4k_*.h264  -t curve_%proj%_avc

rem curve hevc aka new algorithm
%bin% -p %proj%.vqprb -a 4k_*.h265  -t curve_%proj%_hevc

rem calc metrics & bd-rate
%bin% -p %proj%.vqprb -d %results_dir% --set-anchor curve_%proj%_avc --enable-psnr-y –enable-ssim –enable-vmaf
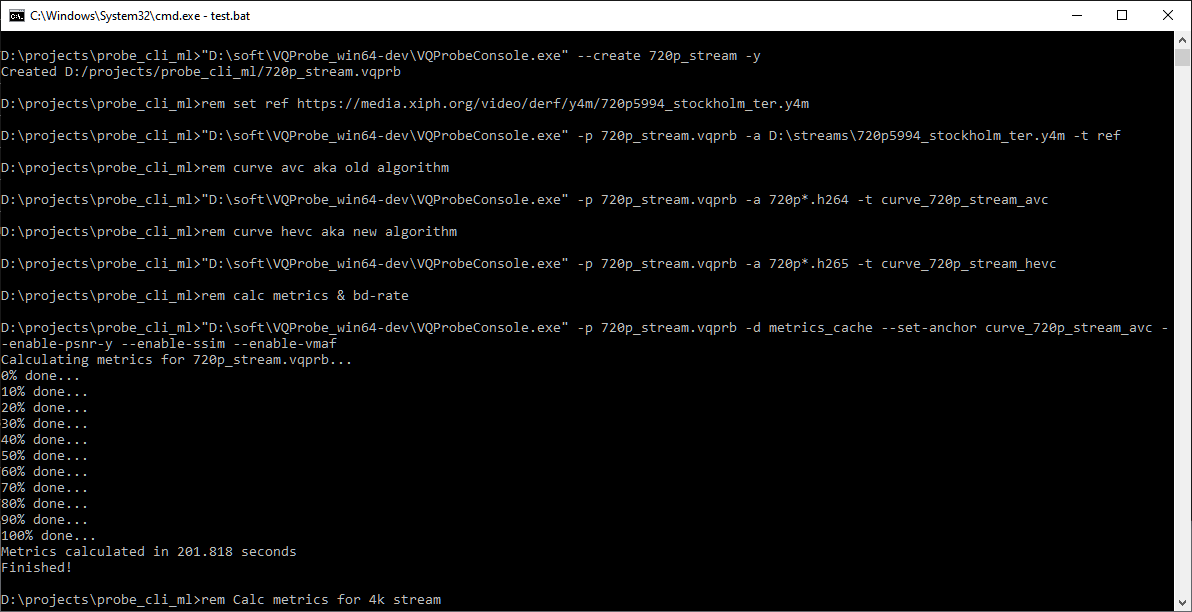
Upon execution, some time is needed for the metrics to be calculated; an example log is provided below:
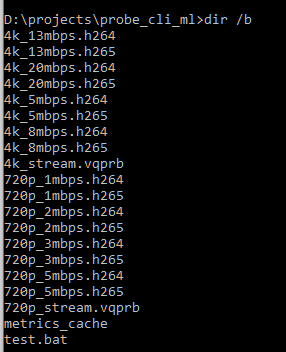
After the results are ready, you will have a directory with the results and generated project file, which you can open in VQ Probe GUI application mode:
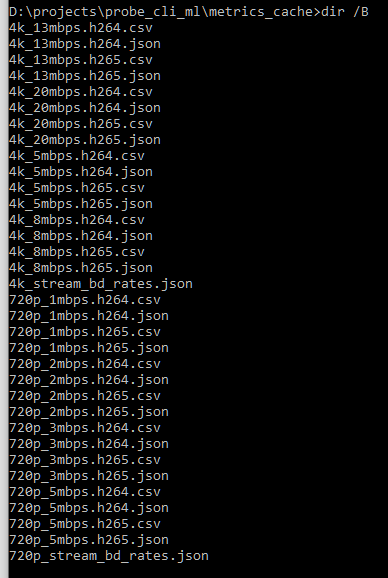
| Root directory with streams | “metrics_cache” directory with results |
|---|---|
 |
|
Let’s dive into those files:
- Each *.csv file contains the raw per frame and the accumulated average value of metrics requested: PSNR-Y, SSIM, VMAF.
- Each *.json file also contains per-frame and average metrics data as well as some meta-information about the source stream, which is usable for further analysis. This json file could be easily parsed and integrated into your QA and CI pipelines.
NB: project file is also a json file and could also be used in your own validation pipelines.
Using VQ Probe GUI for metrics visualization
Metrics visualization
Now let’s try to open our new project in VQ Probe GUI mode. It will automatically load:
- all streams, and for immediate visual analysis
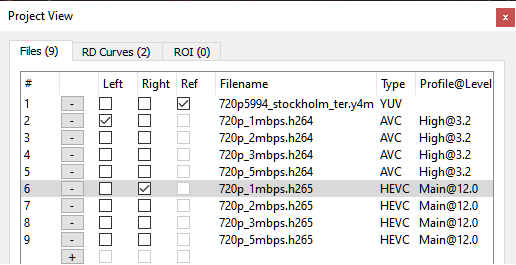
- RD-curve association
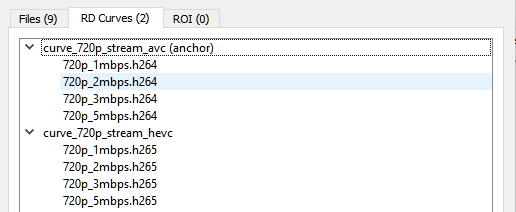
- Calculated RD-curve
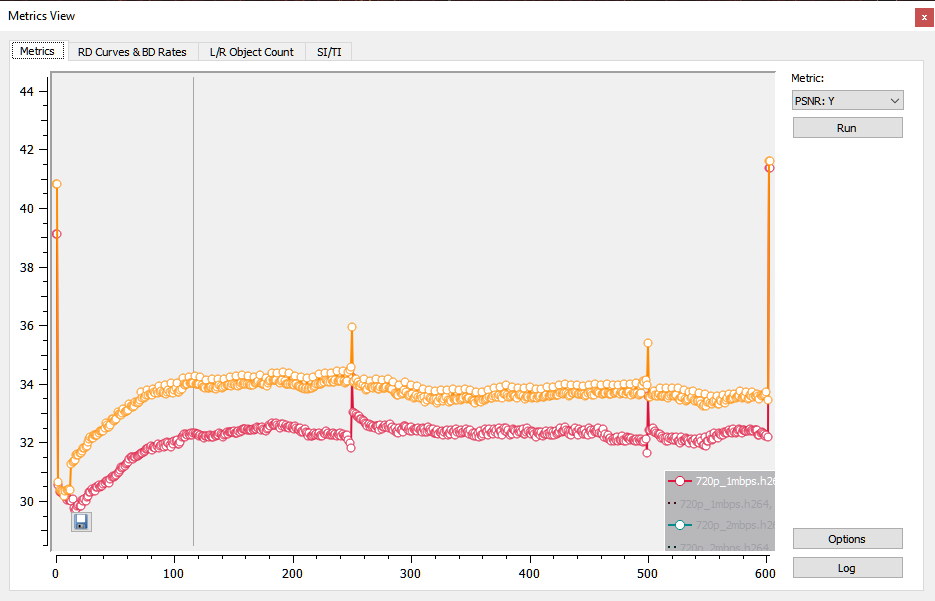
- Per frame metrics
Visual quality analysis
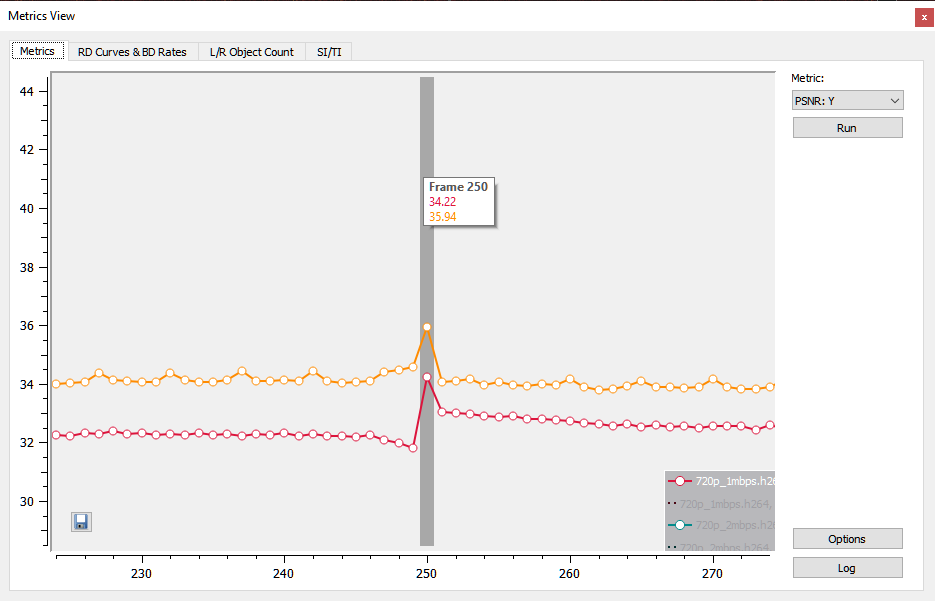
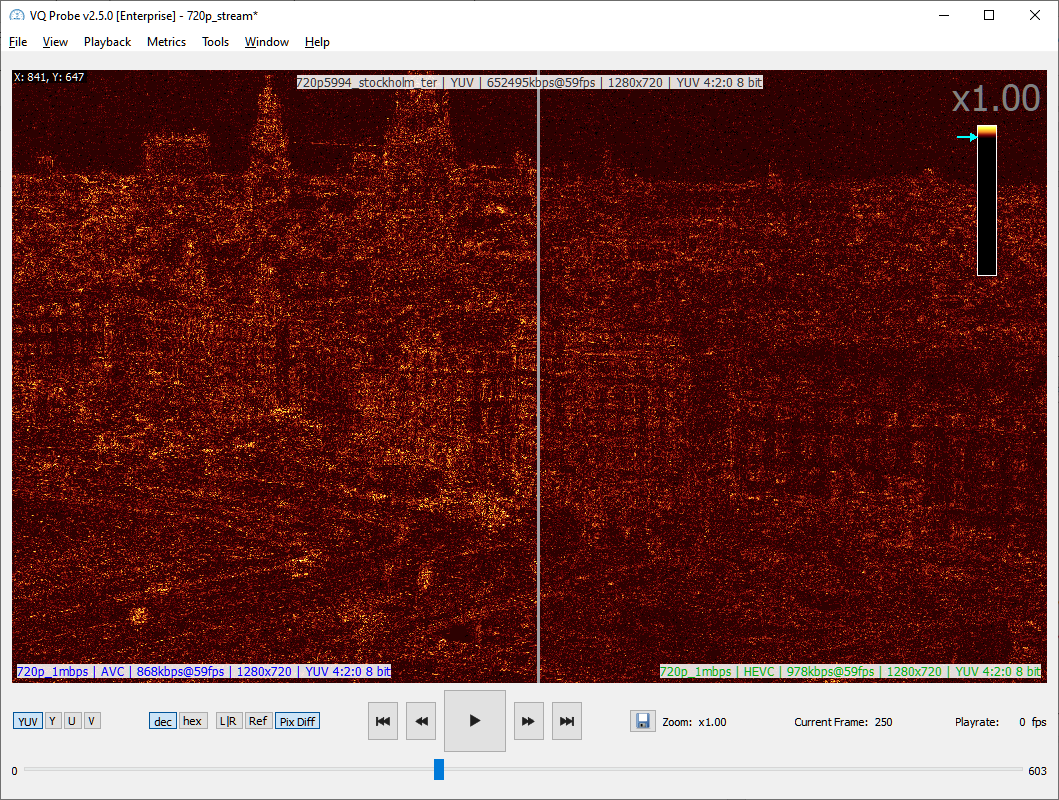
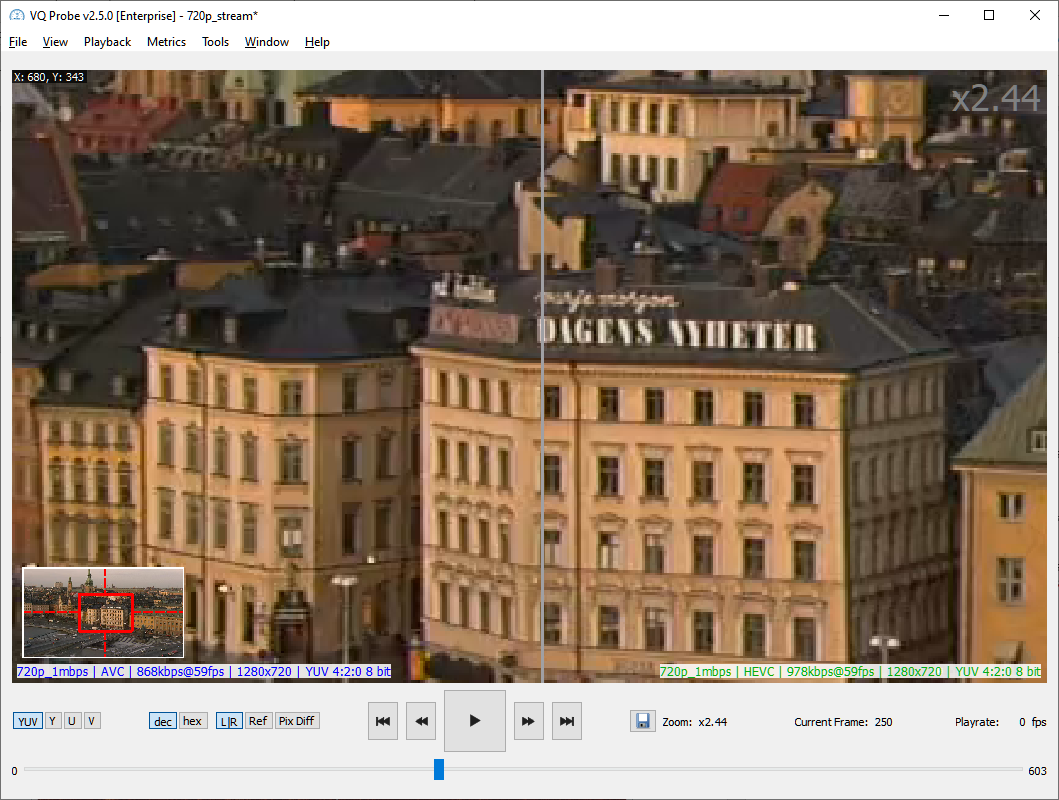
Now let’s try to make some visual analysis. For example, we want to compare ~1mbps stream A vs. stream B points. And choose some frame, say 250, which has a quality peak. Maybe encoder has made good decisions for I frame?
After selection of a pair of streams and a frame index:
We could make either a visual analysis using the overlapping bar to compare the quality of two algorithms or switch to a heat map to visualize distortion and its magnitude against the common reference to see the performance of both codecs, zooming at any scale.
For example, we see that the new algorithm gives less distortion than the old one:
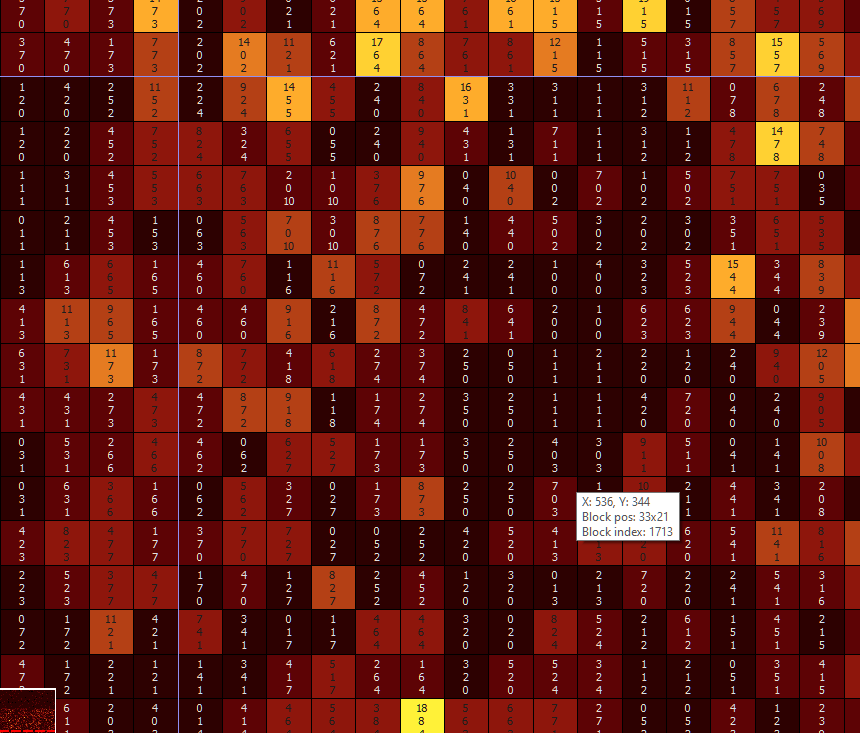
If a specific block needs further analysis for encoder resolution, you could set grid mode based on your encode block scheme and get its index to quickly debug your encoder. Or simply use VQ Analyzer for deep stream syntax analysis.
That’s it! I hope our walkthrough has helped you understand how to use VQ Probe in your daily work. To sum up:
- Simple script and VQ Probe CLI allow the automated metrics calculation and could be easily integrated into other CI/QA frameworks, as they give csv and json outputs.
- Results could be loaded into VQ Probe for:
- RD-curve and per-frame metrics visualization.
- Side-by-side visual quality and distortion analysis of a pair of streams of interest.
- In-depth pixel-based analysis of the region of interest.