Testbot — ViCueSoft’s video codecs validation automation framework

Codec standards are numerous in the world today. Among them, AV1 and VVC are the codecs that are being actively developed, as well as several other codecs. Each codec has its own standards, features and coding tools. Yet how in this multi-codec world to decide which codec is better for your aims? Which codec provides a better quality-performance ratio? Testbot developed by our team at ViCueSoft successfully addresses these and other challenges.
The main idea of this project is to create synergy between different ViCueSoft products. ViCueSoft now has its own analyzer tools (VQAnalyzer and VQProbe), validation tools (DVK), as well as numerous inner developments which provide new features and solutions for the products.
Born as an inner tool for test automation Testbot has now become a framework for deep and flexible testing of several products in the company. Testbot has its own database which supports output and web-interface to interact with the results. It has an ambition to become a core for a new test platform soon. This article is devoted to the analysis of the current Testbolt possibilities.

Main pipeline
Testbot launch is entirely configured by input YAML-file. It consists of keywords and user fields. The fields «stages», «instructions», «filter» and «config» are part of «tb::namespace».
Stages — describe command line launch. In the simplest case it has the fields:
tb::stages:
  - label: create folders
    command: 'mkdir -p /home/dir1 /home/dir2'
Run a command line is possible, but in case of video-decoding the most useful thing is substitution according to cartesian product (interpretation). Let us suppose that the encoding streams ‘stream1.yuv’ and ‘stream2.yuv’ convert to several target bitrates 500, 600, 800 using coding tool. This task involves the following combinations:
tool -i stream1.yuv -b 500 -o 500.stream1.yuv.h264
tool -i stream1.yuv -b 600 -o 600.stream1.yuv.h264
tool -i stream1.yuv -b 800 -o 800.stream1.yuv.h264
tool -i stream2.yuv -b 500 -o 500.stream2.yuv.h264
tool -i stream2.yuv -b 600 -o 600.stream2.yuv.h264
tool -i stream2.yuv -b 800 -o 800.stream2.yuv.h264
This looks easy, but the number of parameters could be larger. According to interpreter-module this can be written as:
tb::stages:
  - label: tool encode
    command: tool -i {:streams.stream} -b {:sets.target_bitrate} -o {:sets.output_bitrate}.{:streams.stream}.h264

sets:
  - 500
  - 600
  - 800

streams:
  - stream: stream1.yuv
  - stream: stream2.yuv
For each «tb::stages» item user can define tags and links.
Using tags, a user defines features of launch. This establishes a connection between launches to configure subsequent plots or to supplement metrics. Links complement tags with urls to be shown in the final report.
Sync models
Testbot supports parallel compilation. Model of «tb::stages» defines synchronization mode. The amount of max parallel processes can be defined as pp=. There are three sync modes defined: “no”- turn it off, “intra”, “inter”. The best way to demonstrate sync modes is to show the Pic below.
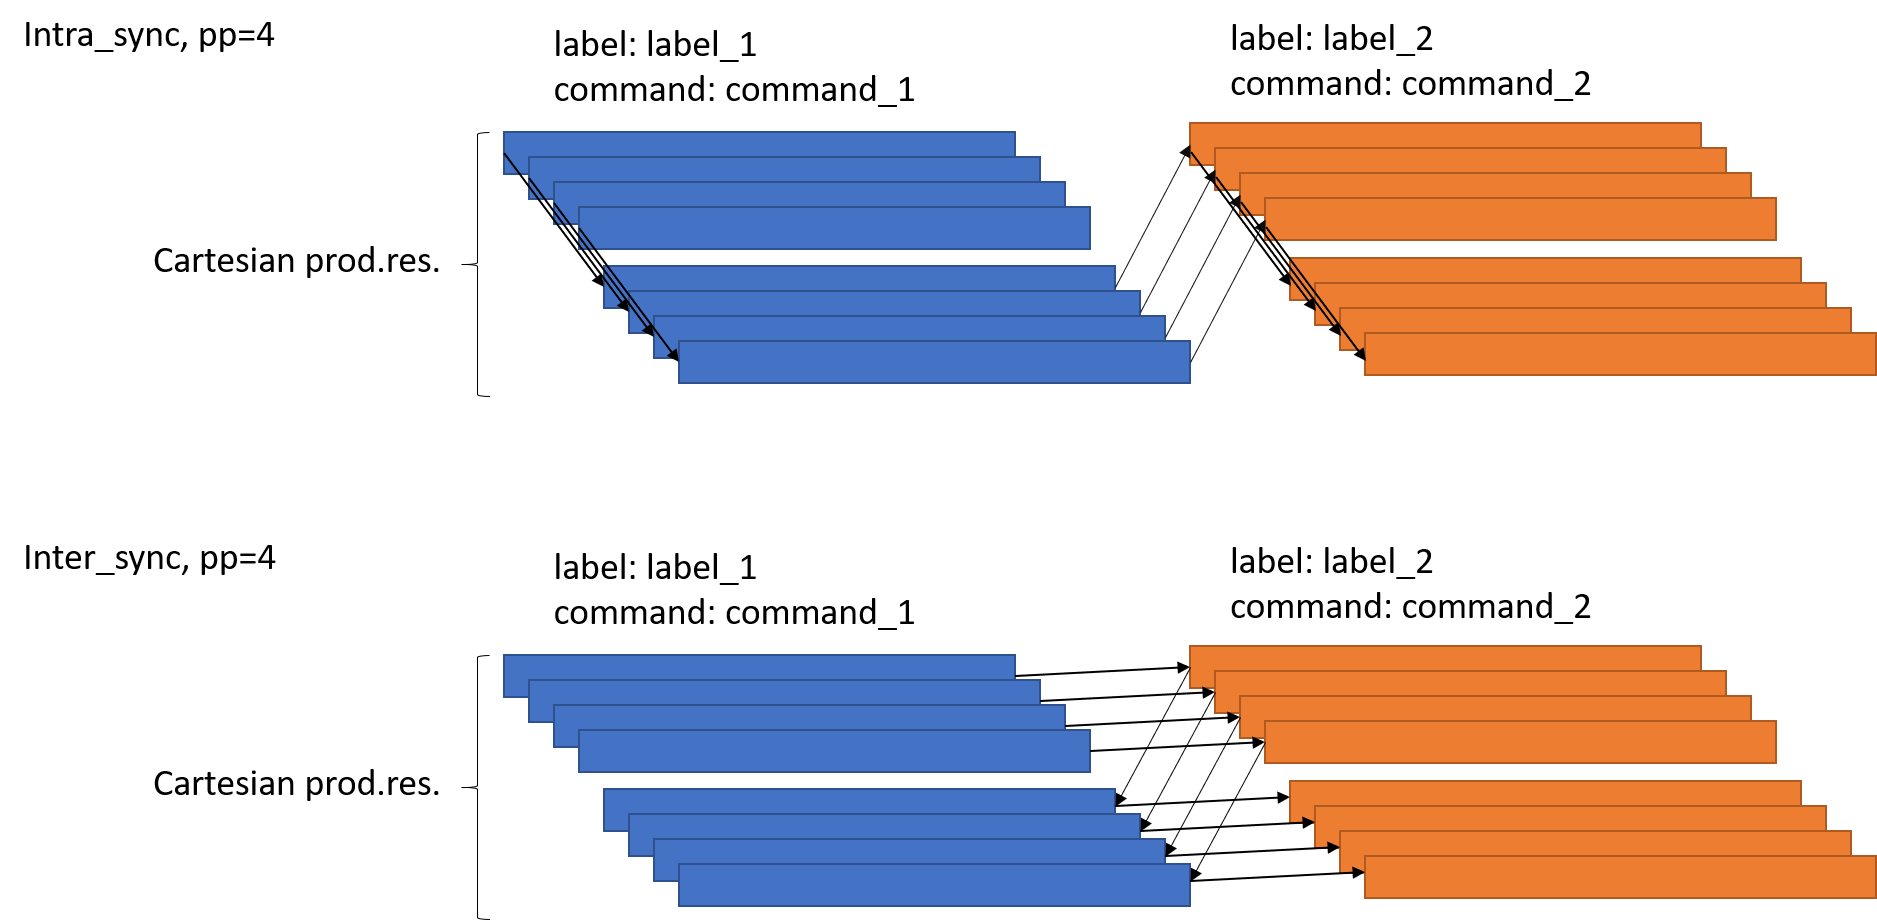
tb::stages:
  - model: inter_sync, pp = 4
Instructions
Instructions describe use of tool parameters in the function style. It could be useful to clarify «tb::stages» using patterns of tool usage. Args can have call, name, to turn off option use, value to modify each option and set default*.* In our case for a coding tool with fixed target bitrate (value=700) and with default input and output the names will be:
tb::stages:
  - instruction: tool(bitrate=700)

tb::instructions:
  tool:
    label: tool-instruction
    command: tool
    args:
      - name: input
        call: '-i {}'
        value: {:streams.stream}
      - name: bitrate
        call: '-b {}'
        value: {:sets.target_bitrate}
      - name: output
        call: '-o {}'
        value: {:sets.output_bitrate}.{:streams.stream}.h264
Filter
Having prepared database of stream parameters in YAML-format, a user can filter streams to be tested according to a codec type or format (for high-definition only, for example). It is defined as follows:
tb::filter:
  streams:
    - width != 640
    - frames == 240
    - bitrate == [1000,2000]

streams:
  - stream: stream1.h264
    type: h264
    frames: 240
    width: 704
    height: 576
    framerate: 30
    bitrate: 1000
  - stream: stream2.h264
    type: h264
    frames: 300
    width: 704
    height: 576
    framerate: 30
    bitrate: 2000
Timeout
This feature is useful for catching hang-ups of the testing program. Timeout can limit the time of execution. For example, setting limit to 500 seconds can be defined as following:
tb::config:
  timeout: 500
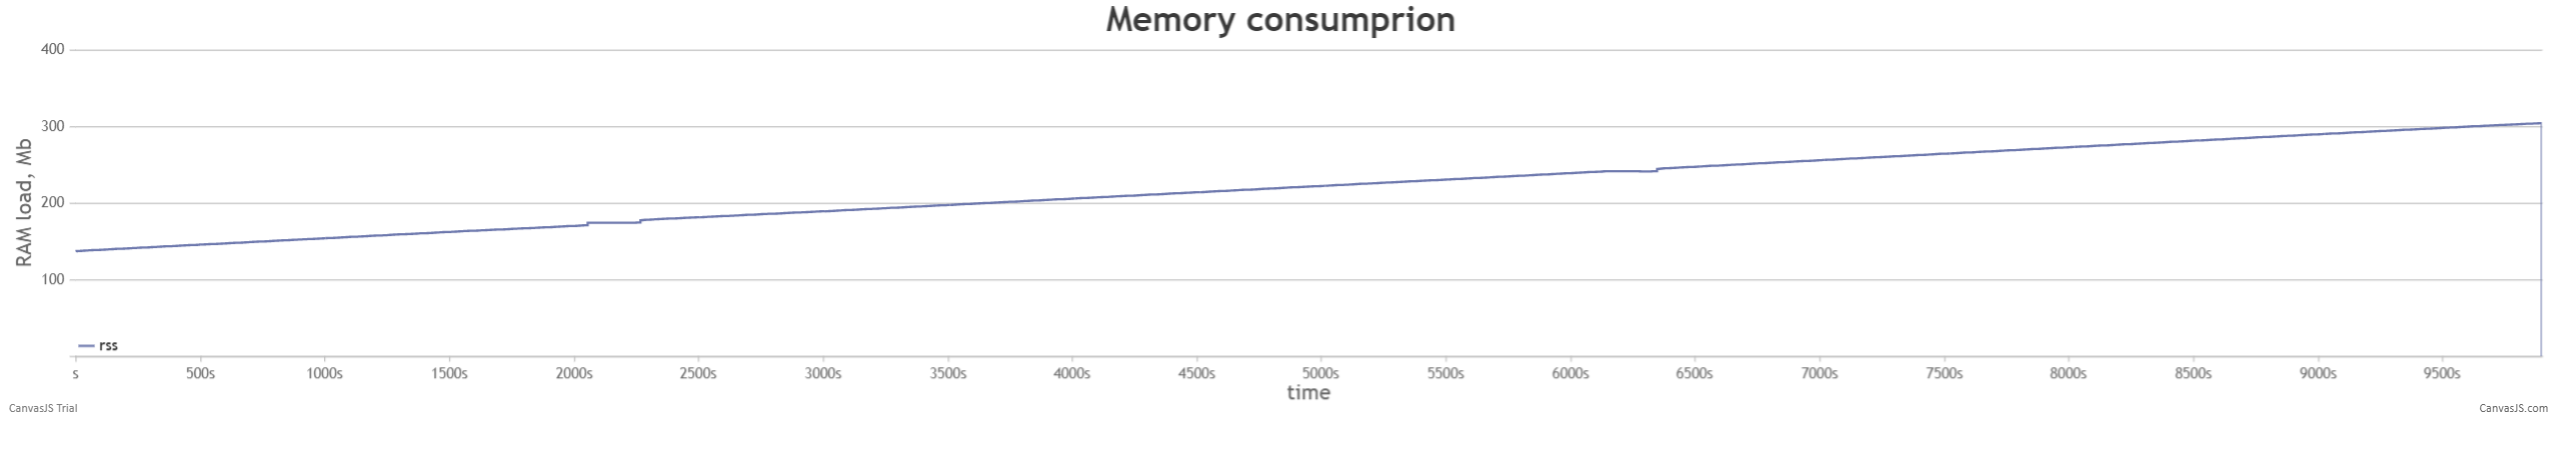
Memory consumption monitoring
Memory leaks detection is another useful built-in feature. For memory consumption test a user defines growth (in %) in «tb::config». When the process ends, this test exits with non-zero status if the increase of RAM consumption was overcoming.
tb::config:
  mem_increase_threshold: 10
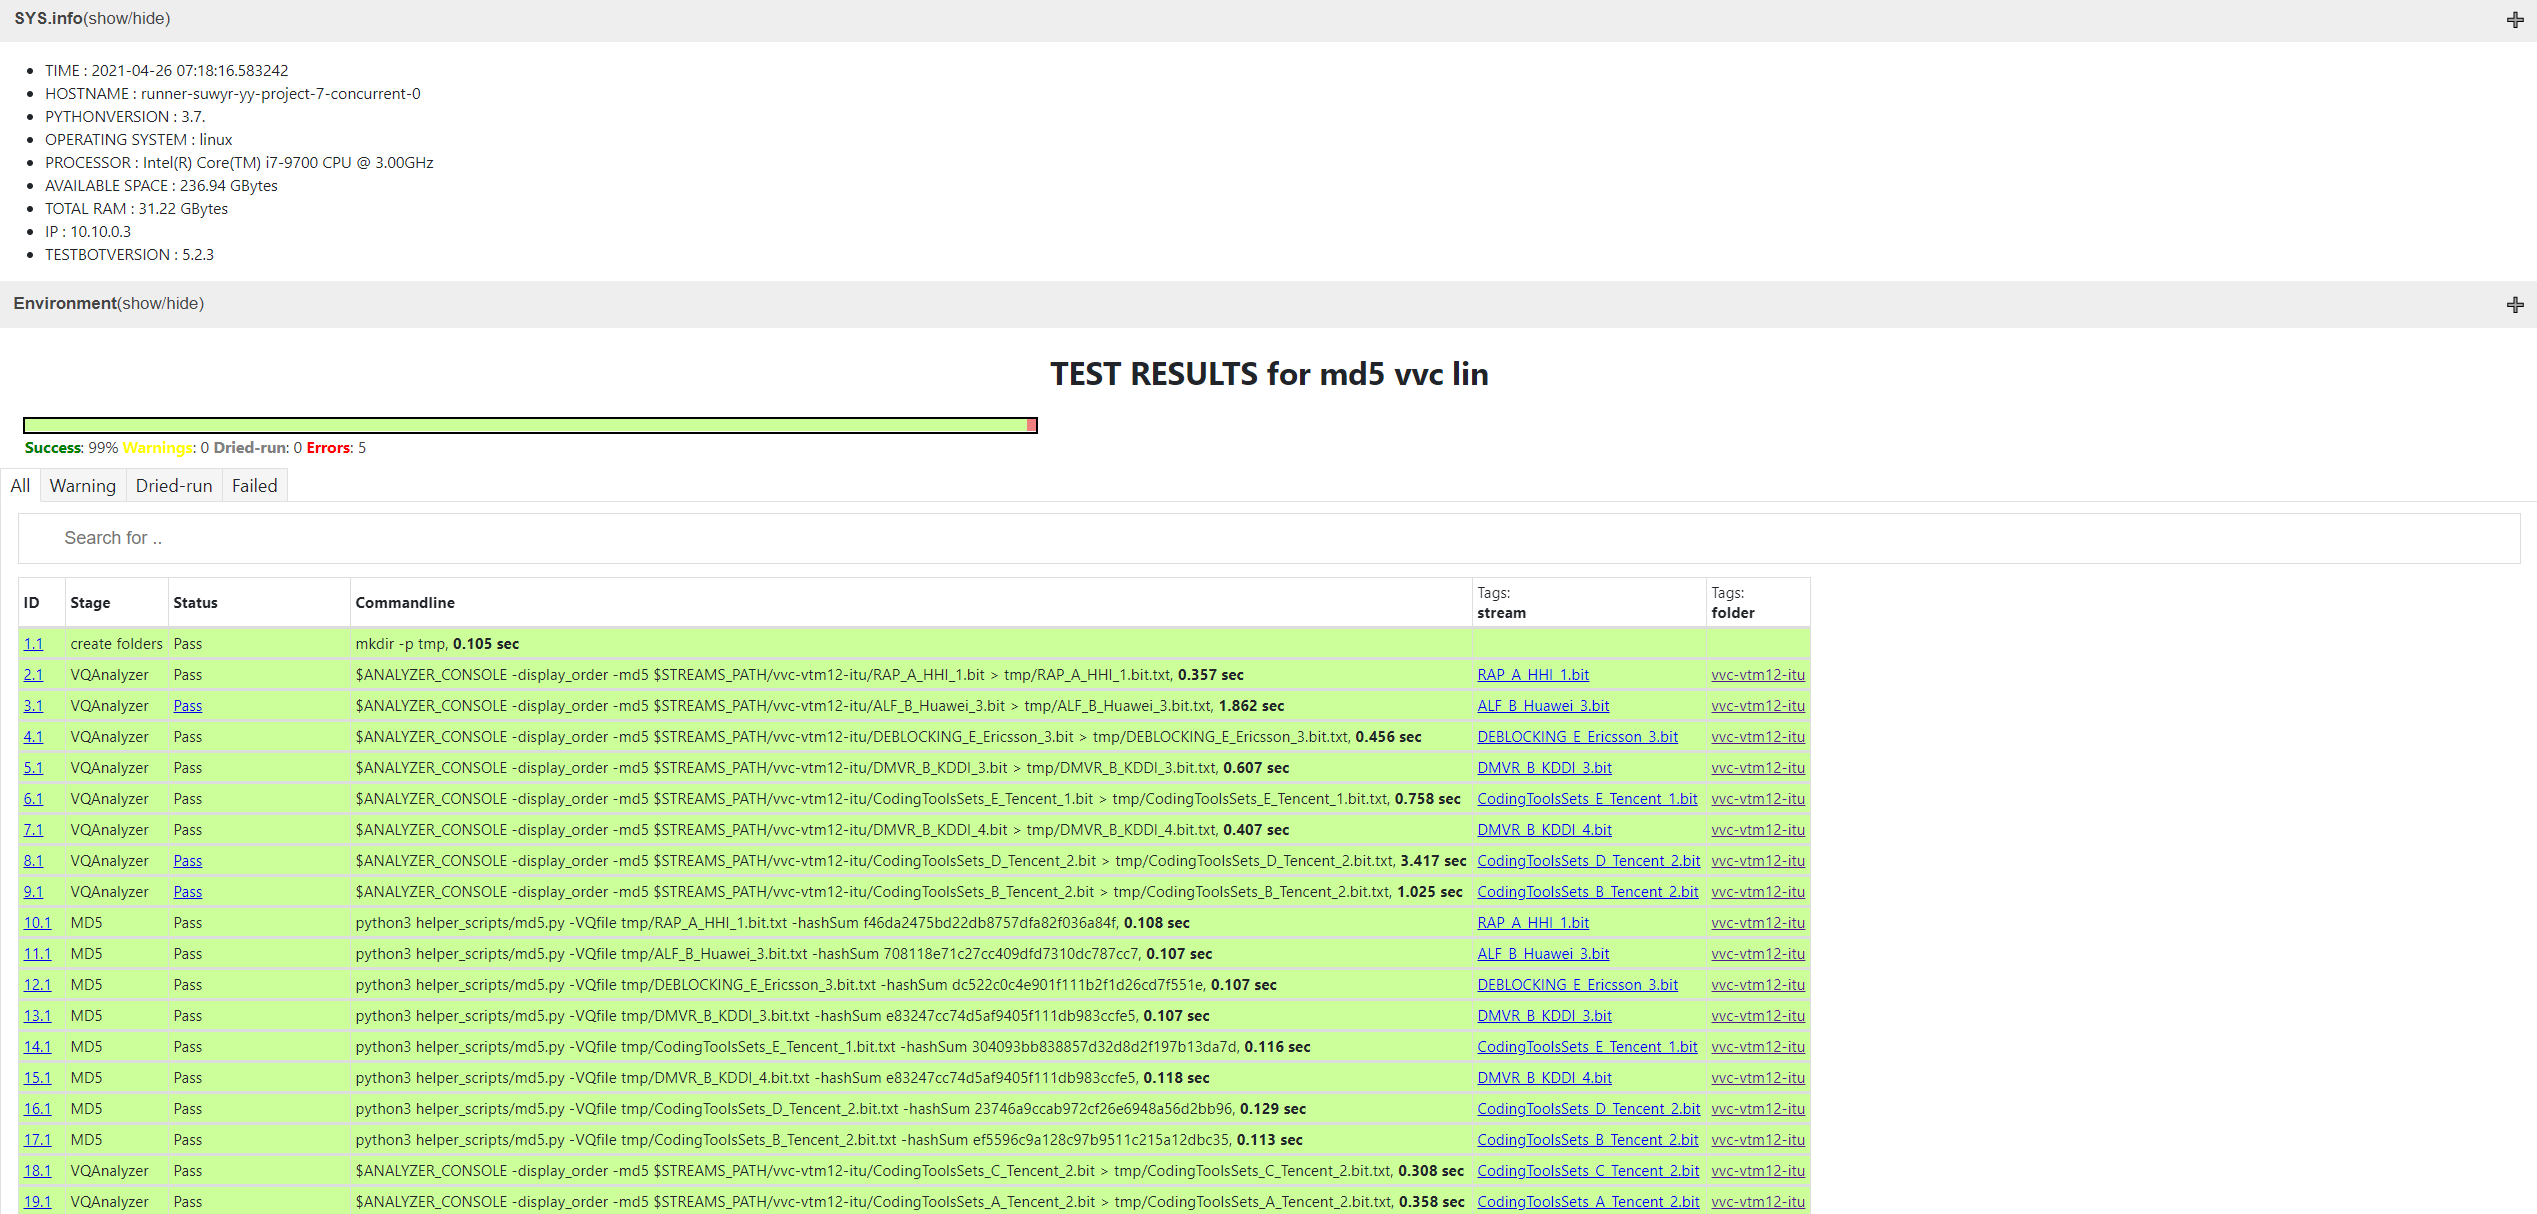
Functional testing
Functional testing answers the question “yes or no” to the basic functions of the product. Some functional tests are written as Testbot’s helper scripts. VQ Analyzer’s functional tests check correspondence of hash-sum of the decoded and the original stream. Native tests can also check quality in terms of the lower edge of the acceptable quality of the decoded stream, count bitrate of the decoded streams or compare headers of stream slices. Testbot supports external python scripts and can be extended by them. At the end of testing Testbot plots an HTML-page as a report. It provides information about launch, such as time, hardware, environment variables and table with command, duration, exit status and other.
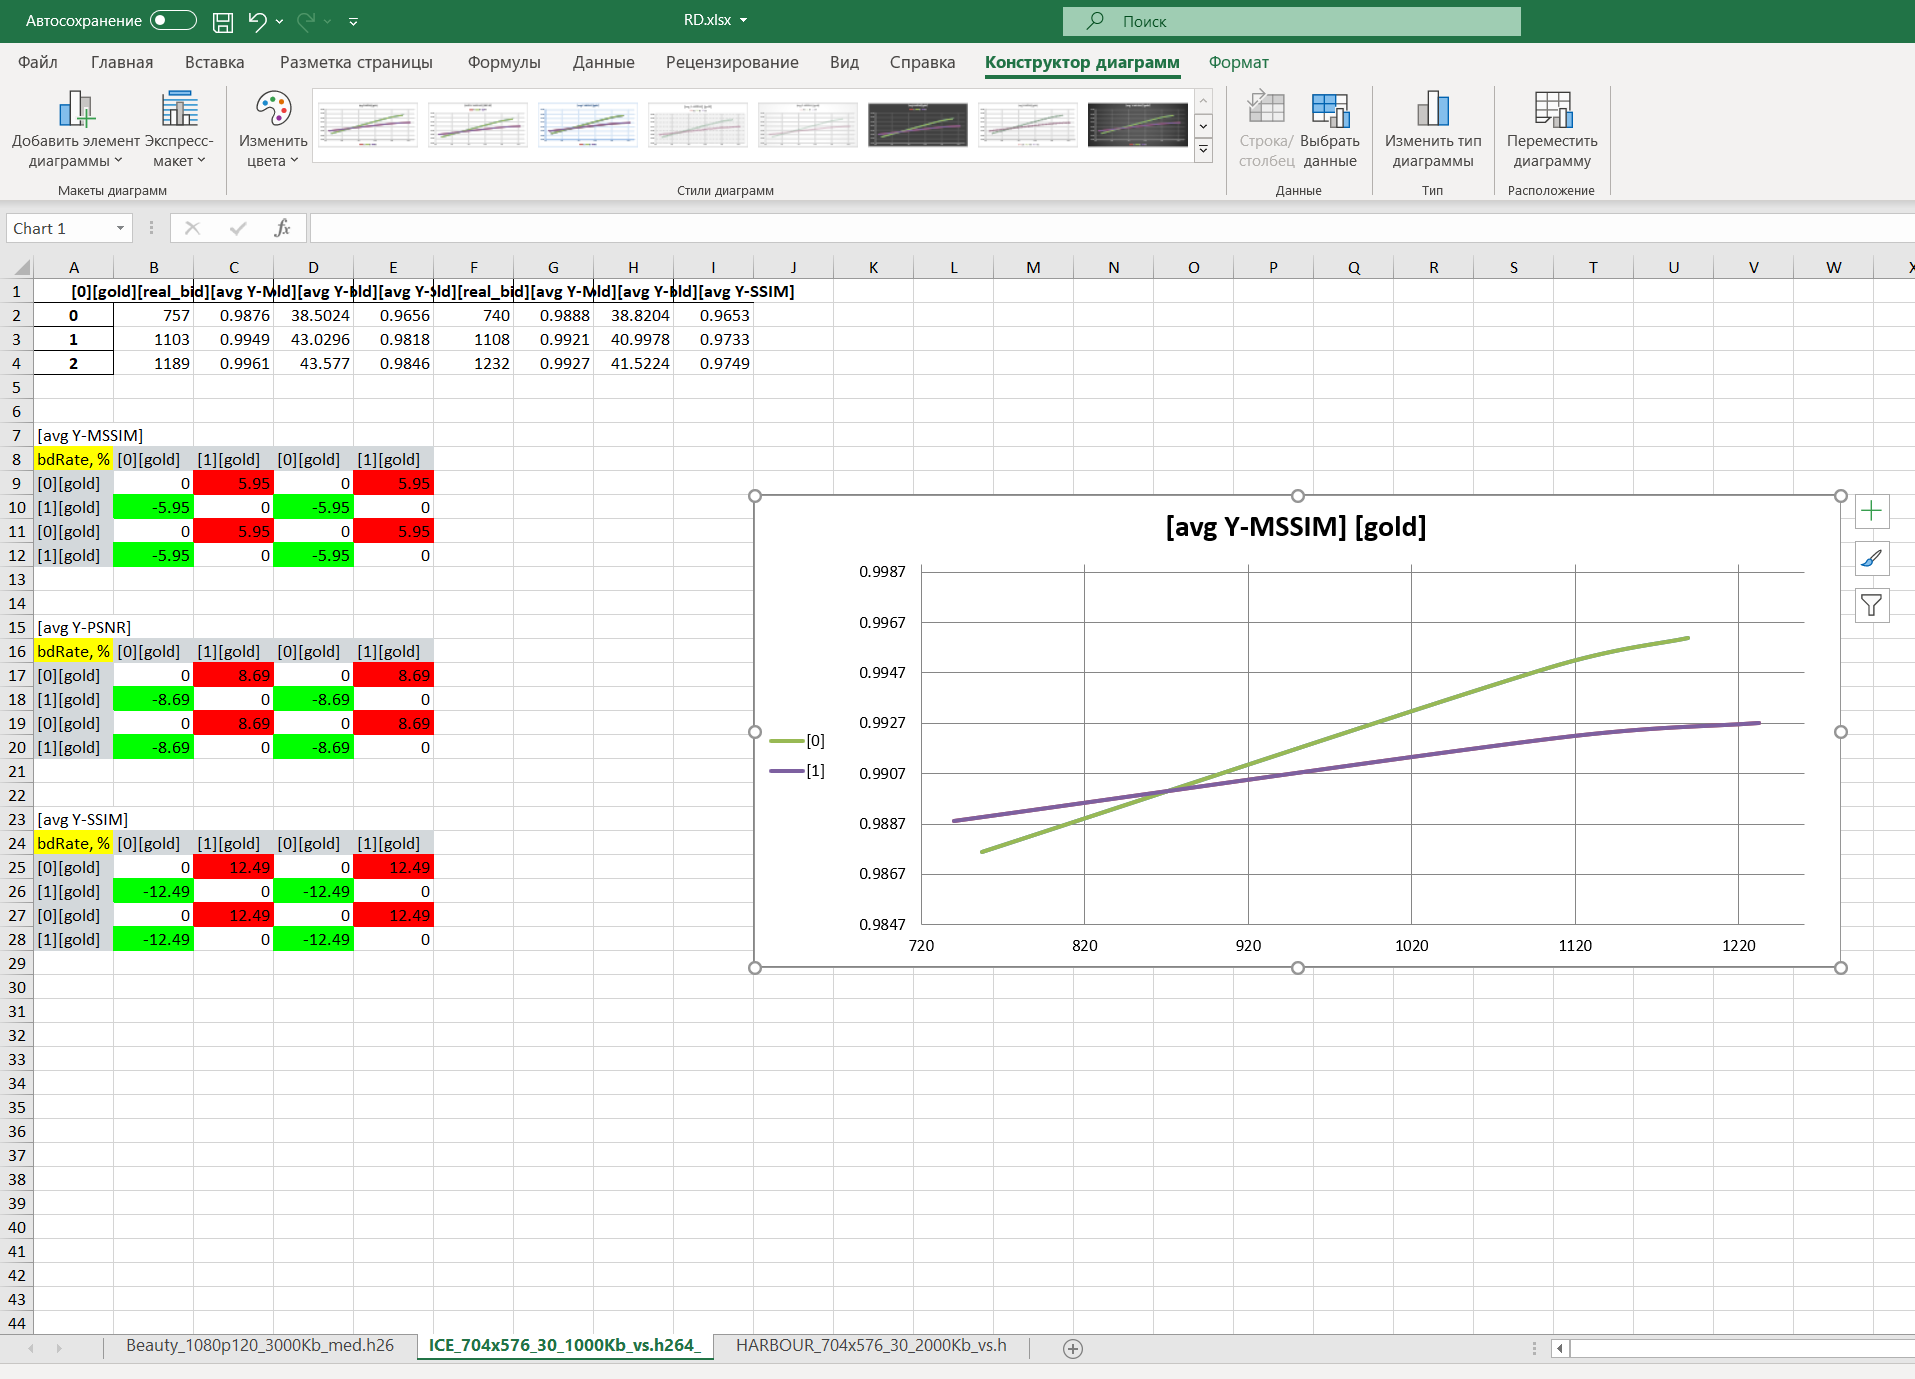
Quality & performance testing
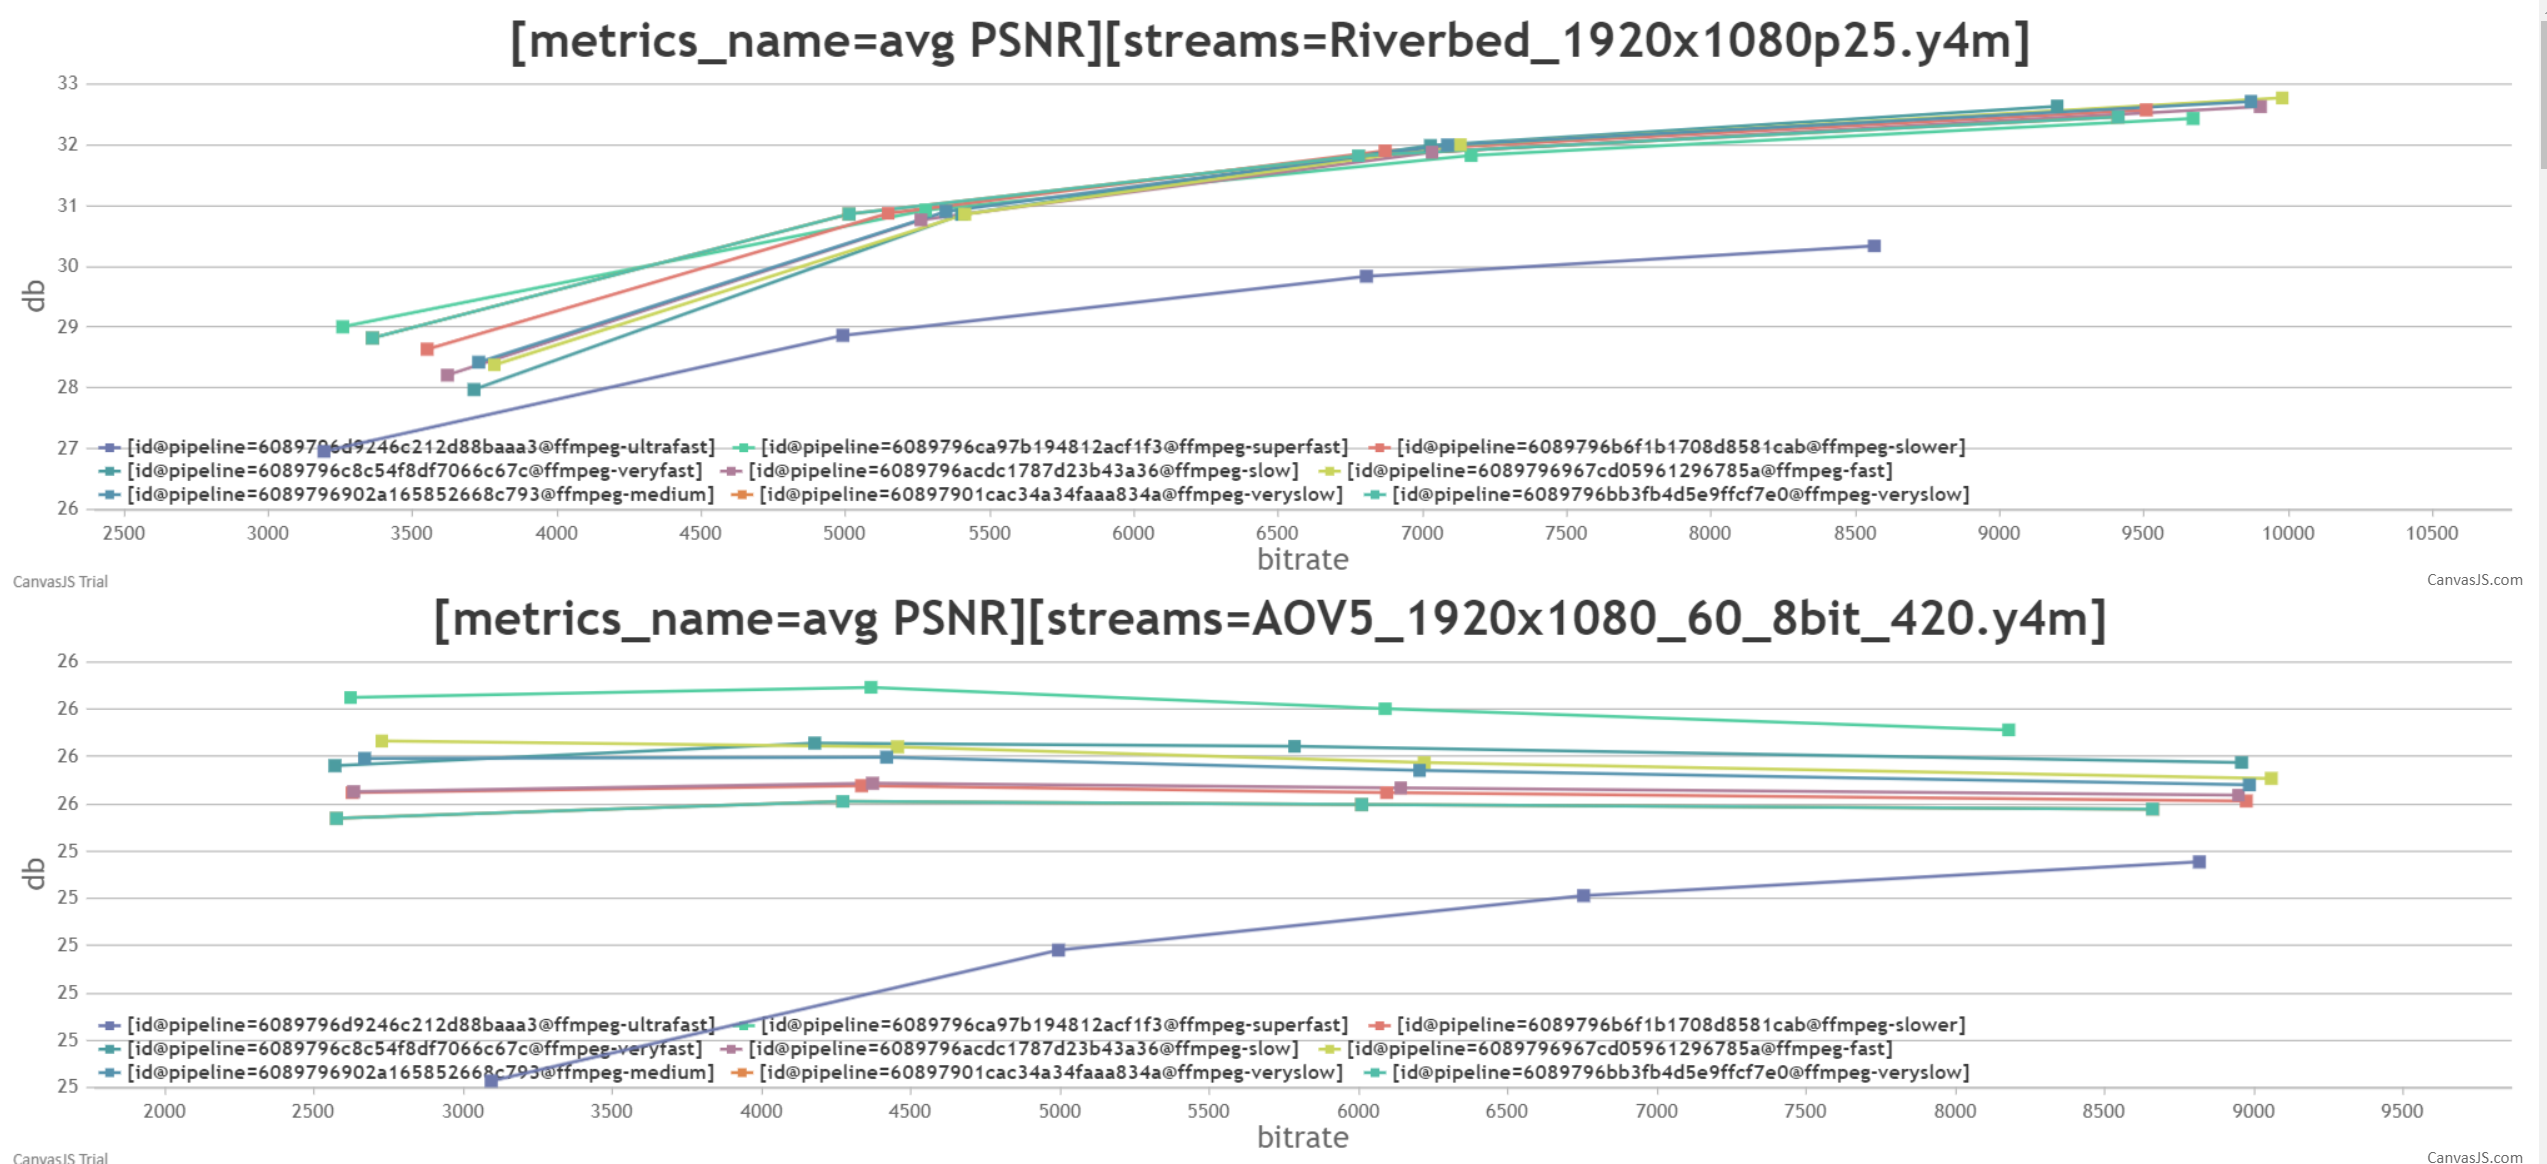
Quality and performance testing provide a more detailed view. Special modules of Testbot collect and process data. According to terms of «tags» Testbot make reports with graphs. So, collecting data from different decoding sessions or even launches a user can plot per-frame charts or RD-curves with BD-rate computed. Collecting duration of the decoding session a user can get a performance report. Its behavior is also defined by config-file in YAML-format; the results are presented as autogenerated Excel files.
Testbot-web
At the end of each launch Testbot uploads all info into the database, so these results become available to the company. Testbot has a web-interface to interact with the results.
From this interface a developer can monitor test results and compare them with the previous launches. It is possible to get a log of each process, plot a memory consumption chart, download this report to show to the customer or download a problem stream for a detailed view.
A user can interactively plot their own per-frame & RD-curves with the collected data from the database.
If you are looking for a way to optimize and improve the quality of video transferring or streaming services, you might want to try our products.