Objective and Subjective video quality assessment

Quality of experience
In the more and more wide spreading of audio and visual communications using technical devices between humans we essentially need to evaluate the quality of such communications.
The main user of any media communication service is a human, and so ITU-T P.10/G.100 (11/2017) introduces the concept of “Quality of Experience (QoE)” defining it as
6.209 The degree of delight or annoyance of the user caused by an application or service.
This concept is very broad as we see next part that states:
QoE influencing factors include the type and characteristics of the application or service, context of use, the user's expectations with respect to the application or service and their fulfilment, the user's cultural background, socioeconomic issues, psychological profiles, emotional state of the user, and other factors whose number will likely expand with further research.
In contrast, there is another similar term “Quality of Service (QoS)”, i.e., the totality of characteristics of a telecommunications service that bear on its ability to satisfy stated and implied needs of the user of the service (see [b-ITU-T E.800]).
QoS is more technical focusing on an ability of service to provided its stated functionality.
According to the above-mentioned, a lot of factors need to be taken into consideration when QoE assessment is performed.
We could split QoE influential factors into two classes:
- Human factors – user background, expectations, emotional state and so on.
- Technical factors – settings and characteristics of technical system used for media communications.
From technical point of view media communication pipeline could be split into the following steps:
- Data acquisition and pre-filtering.
- Compression.
- Transmission over networks.
- Reconstruction and presentation to an end user.
From QoE, each step could be described as a sub-class of QoE influential technical factors.
We can say we have carried out a comprehensive assessment, measurement of QoE only when it includes monitoring and measuring many specific isolated factors of influence, therefore it is so important to carry out such (mentioned above) detailed differentiation and classification of these factors.
This article focuses on technical factors of QoE assessment of video channel or video quality assessment in brief.
Video quality assessment techniques
As mentioned before, video signal from source acquisition to user presentation consists of several steps, and at each step the signal quality could degrade. This could involve lossy compression artifacts, network losses, poor presentation device characteristics and so on.
There are two main approaches for video system performance assessment:
- subjective - measurements that directly anticipate the reactions of those who can view the systems being tested. (Rec. ITU-R BT.500-14).
- objective – quantitative methods, either machine learning or direct algorithms which aim to predict and align with the results of subjective assessment as close as possible.
Comprehensive subjective assessment is a complex process involving the setup of controlled environment, viewing conditions, test material preparation and so on. There are various recommendations like Rec. ITU-R BT.500-14 on how to- perform such measurement like double-stimulus impairment scale (DSIS), single-stimulus (SS) methods, and so on.
After measurement, the results are mapped onto such scales as Mean Opinion Score (MOS) or Differential Mean Opinion Score (DMOS). MOS and DMOS are usually considered as the ground truth of video system performance and used as a reference for various objective metrics.
Quality metrics: PSNR, SSIM and VMAF
Based on the above-mentioned, we can say that objective quality assessment methods are quantitative methods which aim to predict MOS.
There is a lot of variants and approaches to objective metrics:
- Full reference, no-reference, and reduced reference, depending on whether the undistorted source signal is needed or not to provide metrics score. In real world, the source image is usually unavailable, so building a “good” no-reference metrics is a difficult and challenging task.
- Top-bottom (TB) or bottom-top (BT) model. In BT model, various basic psychovisual features are evaluated to build an approximation to a human visual system (HVS). In TB, HVS is simulated in its completeness as a black box, and only input-output relations are of interest.
Some of the metrics are freely available, others are sold as proprietary by the companies. The following full-reference metrics are the most available and used for objective quality assessment:
1. Peak Signal-to-Noise Ratio (PSNR): fast and easy to compute metrics. The signal in this case is the original data, and the noise is the error introduced by compression.
2. Structural Similarity (SSIM): the metrics which measures similarity between two images by exploring structural information of spatially close pixels. This very positively perceived metrics has won Emmy award and has more than 30K citations on Google Scholar, which is even greater than citations of some of the video compression fundamental articles like about CABAC or rate-distortion optimization.
3. Video Multimethod Assessment Fusion (VMAF): an aggregate metrics from Netflix, a smart regression of several simpler metrics.
With machine learning and deep learning developments, we could expect the emergence of more aggregate metrics with finer and more precise prediction of MOS, which would help to make better decisions during video compression and transmission and ultimately to provide better QoE for end user.
Practical example
Now that we get some insights about video quality assessment, let’s check practically how to do a typical measurement: we get a sample stream, encode it using different encoder implementations, compare compression quality and get a judgement as to which implementation is better. Of course, we cannot make such decisions based just on one stream, but let’s assume such simplification for the clarity. For a stream, we will use «ducks take off» and for the metrics – PSNR.

First of all, we need to setup common test conditions (CTC) - align coding parameters between various implementations as much as possible to perform adequate comparison.
Second, we should set our major parameter – target bitrate – compression factor to satisfy space or network bandwidth constraints. Although all good implementations aim to keep the target bitrate, real bitrate always will always be different having some deviation. As a result, we need to set several operation points or bitrates to get several encoded streams and use them to plot the parameterized rate distortion curve. Such approach is also called the Bjøntegaard metrics (see ITU VCEG-M33 and VCEG-L38).
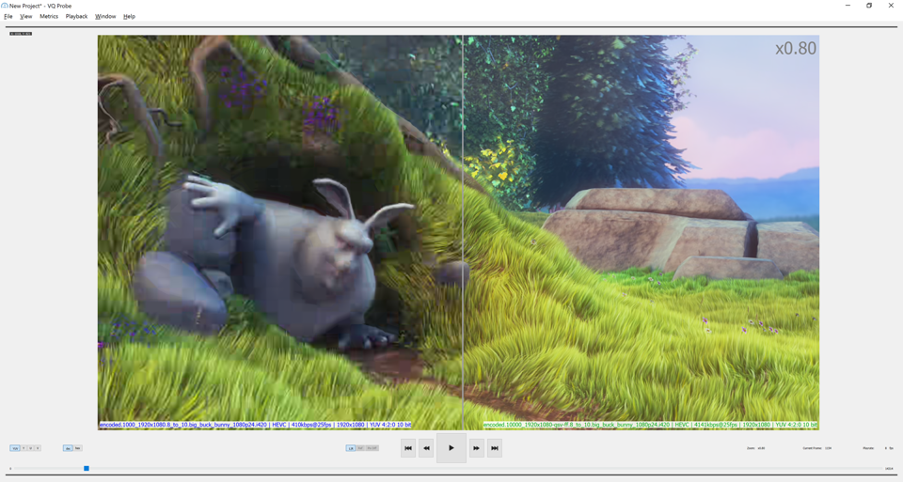
These curves show quality versus bitrate measured for a complete bitstream. On X-axis we have real bitrate, and on Y - distortion (aka quality metric output). All these calculations could be done using our free VQProbe tool
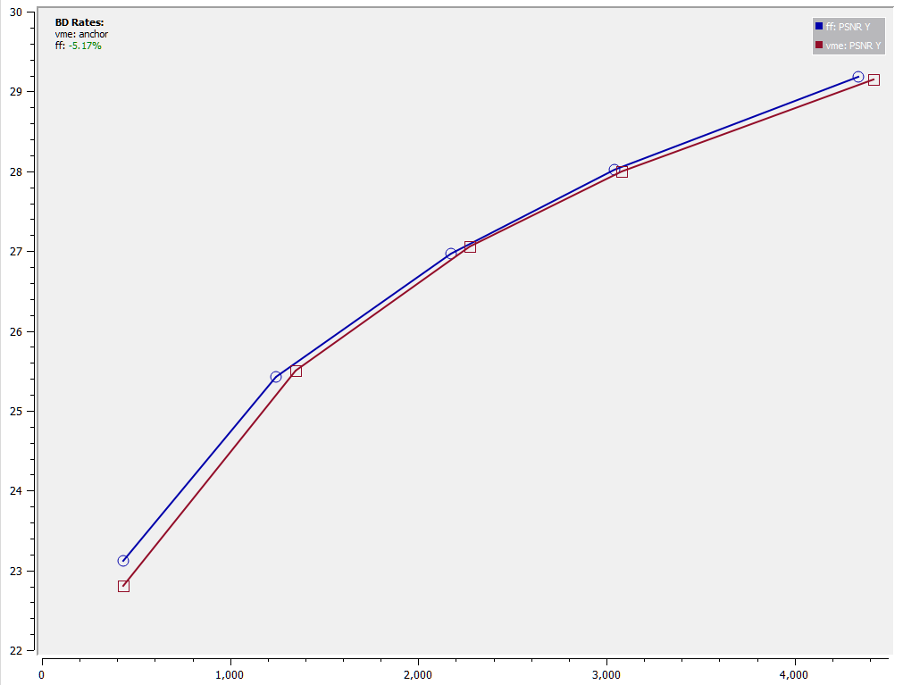
The main idea now is to estimate the area between these two curves to compute an average bit rate savings for equal measured quality - the Bjøntegaard-delta rate (BD-rate). This is done with the help of a piecewise cubic fitting of the curves, where the bit rate is measured in the log domain and integration determines the area between the two curves. The area is further divided by the PSNR range to obtain an average rate difference.
On the plot above, we have two curves, representing two encoder implementations: “red” and “blue”. Here “blue” encoder is slightly better, by 5.17% in terms of BD-rate for a specific stream.
There are several questions here like whether the PSNR metric is a good predictor of subjective quality and how well the difference in BD metric will correlate with difference in subjective quality. However generally, PSNR distortion metric with BD-rate calculations provides a uniform way to compare various encoders’ implementations against each other and helps to focus on creating new and better coding tools.